Utility-Scale PV
Units using capacity above represent kWAC.
2025 Annual Technology Baseline (ATB) data for utility-scale solar photovoltaics (PV) are shown above, with a base year of 2023. The Base Year estimates rely on modeled capital expenditures (CAPEX) and operations and maintenance (O&M) cost estimates benchmarked with industry and historical data. Capacity factor is estimated for 10 resource classes, binned by mean global horizontal irradiance (GHI) in the United States. Estimates of capacity factor that encompass a range associated with advanced, moderate, and conservative technology innovation scenarios across the United States are also presented. The 2025 utility-scale solar PV ATB, for the first time, has analyses for a Research and Development (R&D) cost drivers case and a broader Expanded cost drivers case with each having assumptions for the set of underlying drivers that affect costs:
- R&D cost drivers case: Estimates costs based on R&D-driven improvements only, as applied to technologies and conditions existing during the most recent year with historical data.
- Expanded cost drivers case: Estimates costs based on R&D-driven improvements plus other cost drivers, such as changing market and supply chain conditions.
These definitions are explained further on the Financial Cases & Methods page. Future year projections for each cost drivers case are derived from bottom-up benchmarking of PV CAPEX and bottom-up engineering analysis of O&M costs. The year 2024 reflects the most recent historical data, derived from benchmarks made in the first quarter of 2024. Specific projections are made for 2030, 2040, 2050, and 2060. Straight lines interpolate between the 2024 and 2030 values, between the 2030 and 2040 values, between the 2040 and 2050 values, and between the 2050 and 2060 values. Cost fluctuations that may occur between each set of years are not represented, such as the fluctuations because of policy and market conditions that occurred after the first quarter of 2024.
Each cost drivers case has three projection scenarios for technology advancement and evolution as follows:
- Conservative Scenario: lower levels of R&D investment with minimal technology advancement and market conditions that result in domestically produced PV components
- Moderate Scenario: R&D investment continuing at similar levels as today, with corresponding levels of technological advancement, and market conditions allowing for component price reductions consistent with trends from the past several years
- Advanced Scenario: an increase in R&D spending generates substantial innovation that drives down costs; market conditions reflect improved access to global markets.
Detailed descriptions of the scenarios are presented in the Scenario Descriptions section. Costs within any given year and for any given project can vary based on site-specific or larger market factors. The chart below shows the 2025 ATB R&D and Expanded cases' CAPEX trajectories for utility-scale PV in the context of historical ranges.
Historical Sources: (Joachim Seel et al., 2024); (DOE, 2024); (Ramasamy et al., 2023).
Future Projections: 2025 ATB.
All prices quoted in WDC are converted to WAC (1 WDC = ILR × WAC).
Resource Categorization
The 2025 ATB provides the average capacity factor for 10 resource categories in the United States, binned by mean GHI. Average capacity factors are calculated using county-level capacity factor averages from the Renewable Energy Potential (reV) model for 1998–2021 (inclusive) of the National Solar Radiation Database (NSRDB). The NSRDB provides modeled spatiotemporal solar irradiance resource data at 4-kilometer (km) spatial resolution and 0.5-hour temporal resolution. The county-level mean GHI is calculated by aggregating each NSRDB point’s multiyear mean GHI to provide a county’s mean GHI for all years included in the analysis. The U.S. average capacity factor for each resource category is weighted by the land area (square miles) of each county within the GHI resource category. The county estimated land area is provided by geospatial and tabular data from the U.S. Census. The following map shows average annual GHI in the United States.
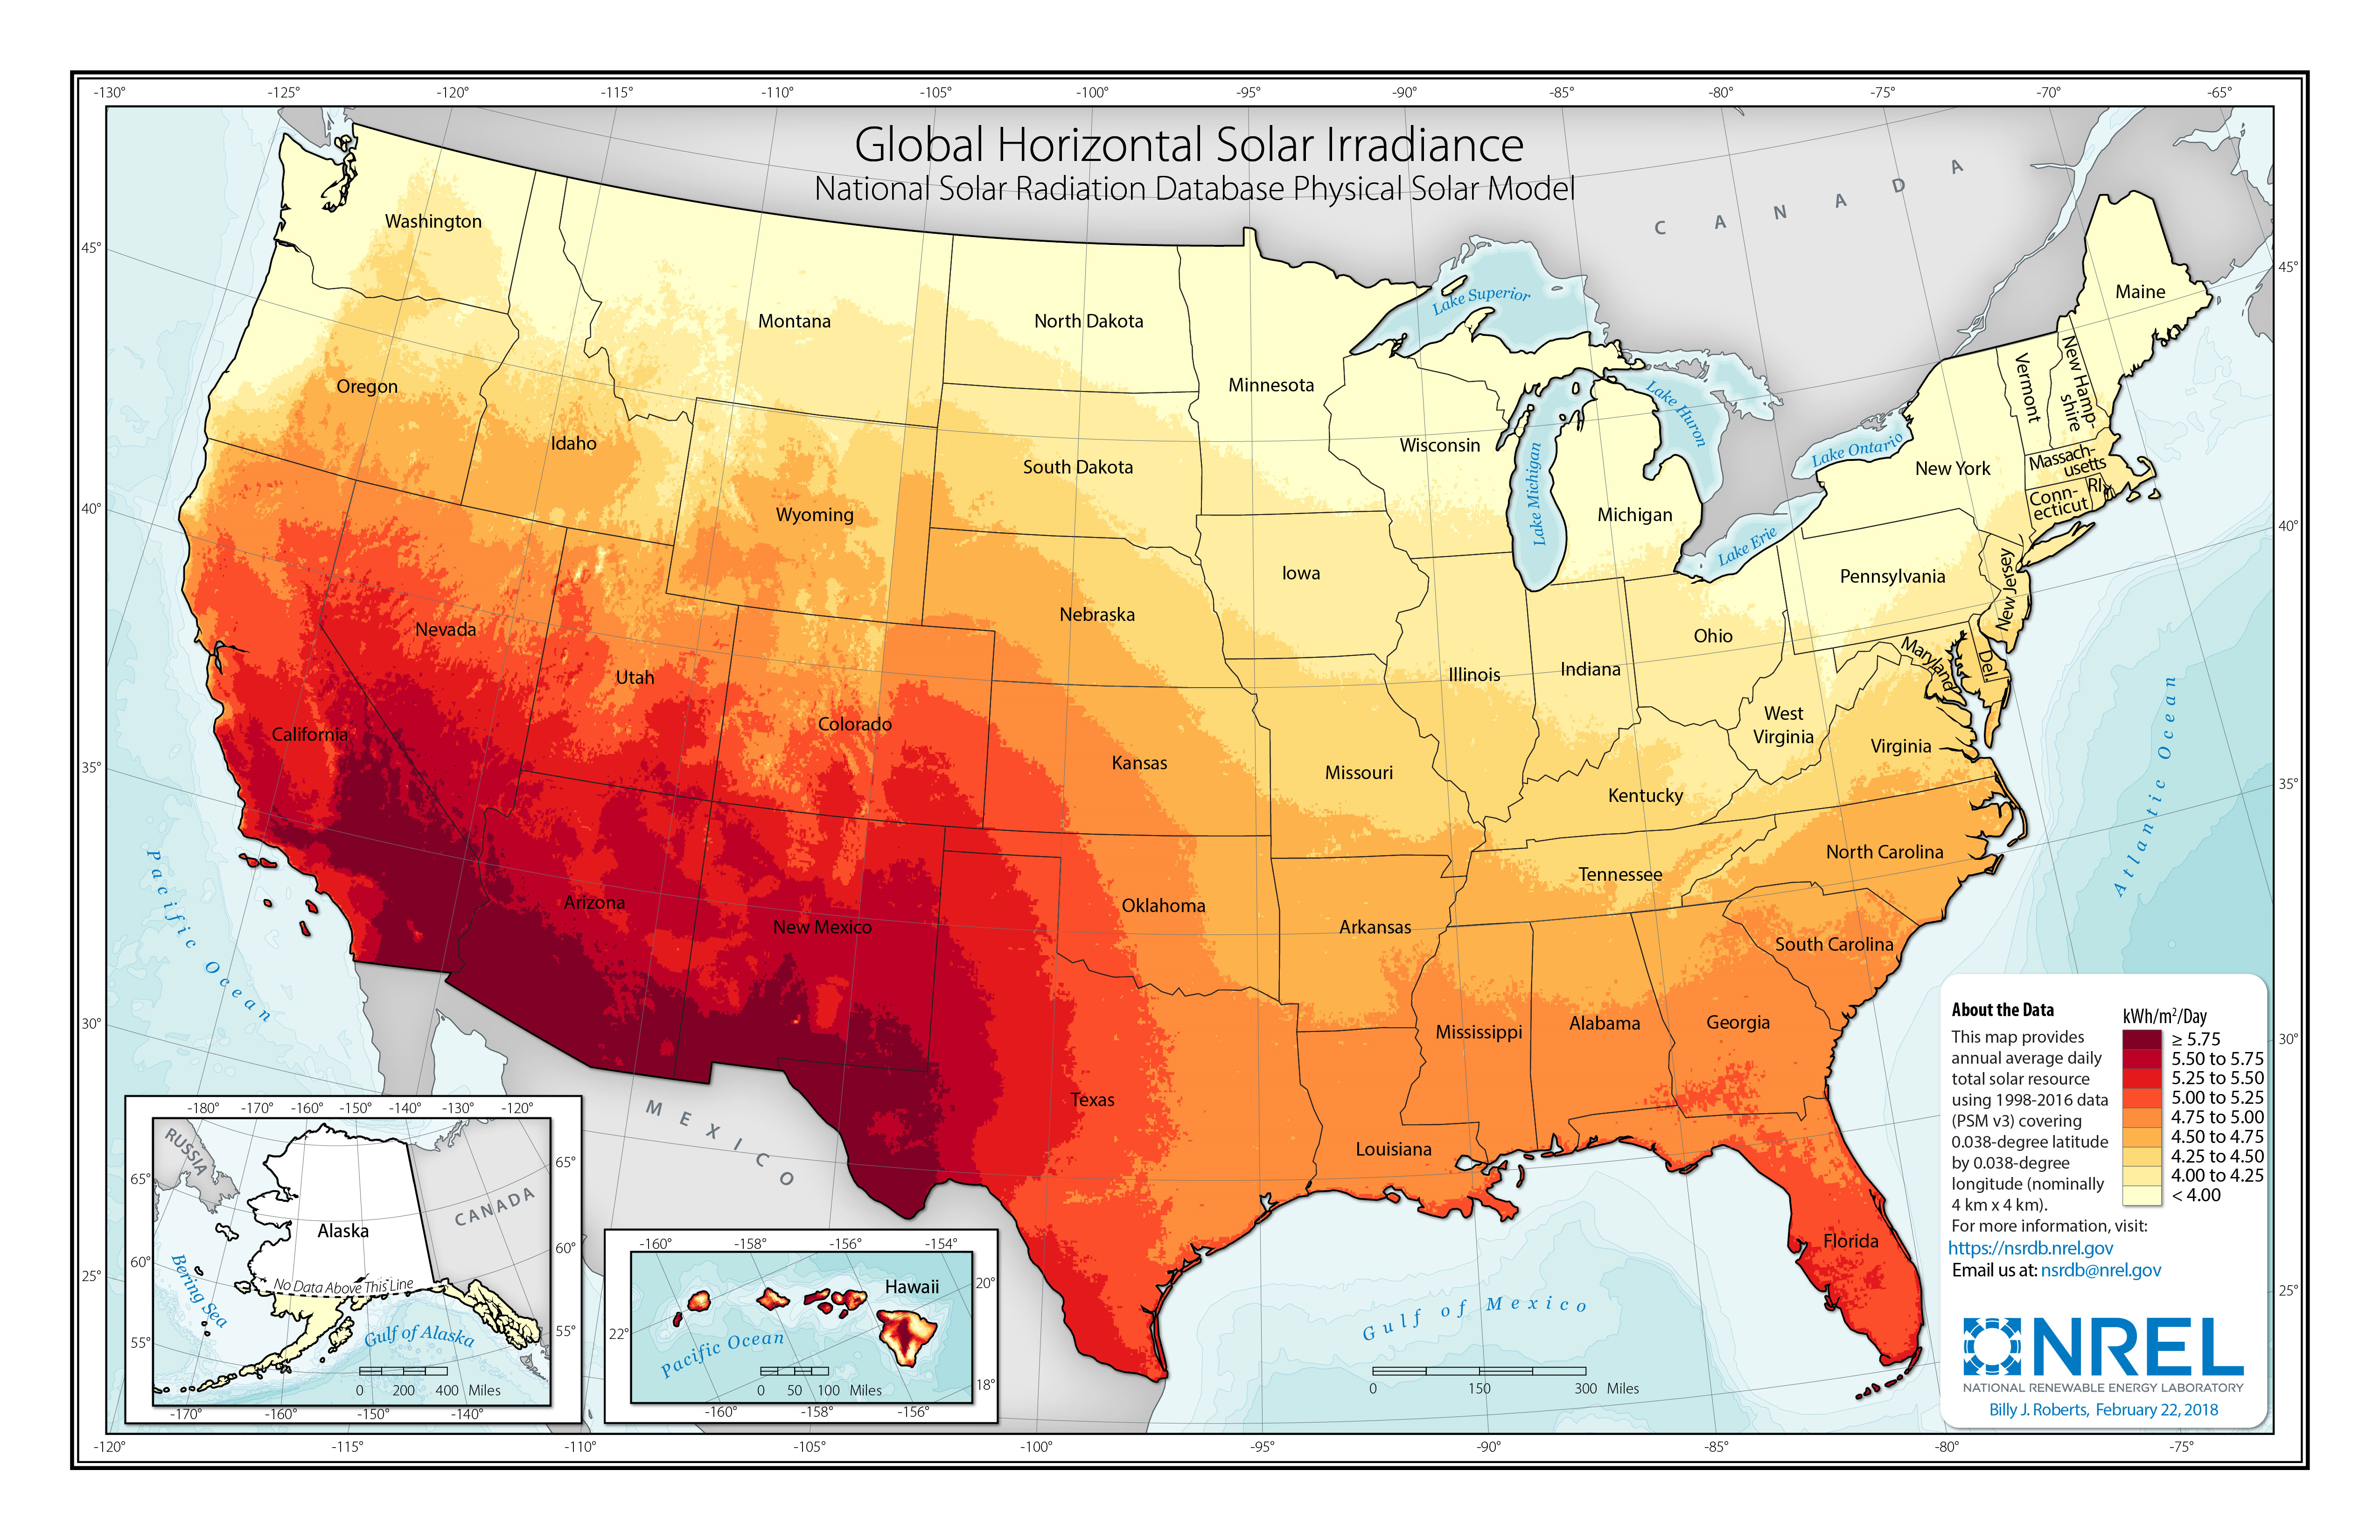
The following table summarizes the estimated 2021 capacity factor (in the first year of operation) for each resource category and each resource category's associated U.S. land area.
| Resource Class | GHI Bin (kilowatt-hours per square meters per day [kWh/m2/day]) | Mean Alternating Current (AC) Capacity Factor | Area (km2) |
| 1 | >5.75 | 33.5% | 285,955 |
| 2 | 5.5–5.75 | 32.4% | 405,147 |
| 3 | 5.25–5.5 | 30.9% | 351,716 |
| 4 | 5–5.25 | 29.4% | 428,289 |
| 5 | 4.75–5 | 27.9% | 469,396 |
| 6 | 4.5–4.75 | 26.5% | 687,604 |
| 7 | 4.25–4.5 | 25.1% | 646,344 |
| 8 | 4–4.25 | 24.1% | 697,356 |
| 9 | 3.75–4 | 23.0% | 537,441 |
| 10 | <3.75 | 21.1% | 97,193 |
Scenario Descriptions
| Year | Module Efficiency | Inverter Power Electronics | Installation Efficiencies |
| 2030 | Technology Description: R&D case: Module efficiency (24%) is based on the International Technology Roadmap for Photovoltaic (ITRPV) projected 2030 Tunnel Oxide Passivated Contact (TOPCon) and Passivated Emitter and Rear Cell (PERC) module efficiency. TOPCon is assumed to almost fully constitute the market, with some PERC presence. This scenario assumes similar proportions of U.S. manufacturing and imported products as existed in 2024, with no product improvements beyond efficiency increases. The 2024 module market price ($0.34/watts direct current [WDC]) and efficiency (21%) from (DOE, 2024) are adjusted for 2030 module efficiency, with similar supply and demand conditions as in 2024, resulting in a module cost of $0.29/WDC. Expanded case: This scenario assumes module price increases because of significant trade barriers and U.S. manufacturers scaling up capacity, with PERC constituting the entire market at an efficiency of 22%. National Laboratory of the Rockies (NLR) internal analysis projected the cost of a potential fully U.S. manufactured modules market resulting in a module cost of $0.47/WDC. Justification: This scenario represents the low end of projected module efficiency and high end of cost projections. | Technology Description: R&D case: No change vs. the 2024 modeled market price (MMP), i.e., an inverter price of $0.03/WDC (DOE, 2024). Expanded case: A 20% increase in inverter costs is assumed because of trade barriers. An MMP basis results in an inverter price of $0.04/WDC. Justification: Increasing trade barriers and reliance on domestic manufacturing may result in higher costs, reflected in the Expanded case. The R&D case represents a conservative projection of inverter prices. | BOS and labor costs decrease proportionally to the increase in module efficiency. |
| 2040 | Technology Description: R&D case: Module efficiency (25%) uses ITRPV projected TOPCon module efficiency extrapolated to 2040. TOPCon is assumed to fully constitute the market. This scenario assumes U.S. manufacturers have fully scaled up and are operating at an efficient level. The 2024 module market price ($0.34/WDC) and efficiency (21%) from (DOE, 2024) are adjusted for 2040 module efficiency, resulting in a module cost of $0.28/WDC. Expanded case: This scenario assumes module price increases because of significant trade barriers and U.S. manufacturers scaling up capacity, with an interpolated module efficiency of 23%. NLR internal analysis projected the cost of a potential fully U.S. manufactured modules market resulting in a module cost of $0.46/WDC. Justification: This scenario assumes limited improvements in technology efficiency. Market disruptions are not fully resolved in the Expanded case. Module manufacturing is fully scaled up and efficient in the R&D case. | Technology Description: R&D case: No change vs. the 2024 MMP, i.e., an inverter price of $0.03/WDC (DOE, 2024). Expanded case: A 20% increase in inverter costs is assumed because of trade barriers. An MMP basis results in an inverter price of $0.04/WDC. Justification: Increasing trade barriers and reliance on domestic manufacturing may result in higher costs, reflected in the Expanded case. The R&D case represents a conservative projection of inverter prices. | BOS and labor costs decrease proportionally to the increase in module efficiency.
|
| 2050 | Technology Description: R&D case: Module efficiency (25%) is extrapolated from the the 2040 projected efficiency. The 2024 module market price ($0.34/WDC) and efficiency (21%) from (DOE, 2024) are adjusted for 2050 module efficiency, resulting in a module cost of $0.28/WDC. Expanded case: This scenario assumes module price increases because of significant trade barriers and U.S. manufacturers scaling up capacity, with an interpolated module efficiency of 23%. NLR internal analysis projected the cost of a potential fully U.S. manufactured modules market resulting in a module cost of $0.44/WDC. Justification: This scenario assumes limited improvements in technology efficiency. Market disruptions are not fully resolved in the Expanded case. Module manufacturing is fully scaled up and efficient in the R&D case. | Technology Description: R&D case: No change vs. the 2024 MMP, i.e., an inverter price of $0.03/WDC (DOE, 2024). Expanded case: A 20% increase in inverter costs is assumed because of trade barriers. An MMP basis results in an inverter price of $0.04/WDC. Justification: Increasing trade barriers and reliance on domestic manufacturing may result in higher costs, reflected in the Expanded case. The R&D case represents a conservative projection of inverter prices.
| BOS and labor costs decrease proportionally to the increase in module efficiency. |
| 2060 | Technology Description: R&D case: This case assumes module costs remain the same beyond 2050, at $0.28/WDC. Expanded case: This scenario assumes higher module prices because of significant trade barriers, relatively small U.S. manufacturer capacity, and TOPCon constitutes the entire market with an efficiency of 24%. NLR internal analysis projected the cost of a potential fully U.S. manufactured modules market resulting in a module cost of $0.43/WDC. Justification: This scenario assumes limited improvements in technology efficiency. Market disruptions are not fully resolved in the Expanded case. Module manufacturing is fully scaled up and efficient in the R&D case. | Technology Description: R&D case: No change vs. the 2024 MMP, i.e., an inverter price of $0.03/WDC (DOE, 2024). Expanded case: A 20% increase in inverter costs is assumed because of trade barriers. An MMP basis results in an inverter price of $0.04/WDC. Justification: Increasing trade barriers and reliance on domestic manufacturing may result in higher costs, reflected in the Expanded case. The R&D case represents a conservative projection of inverter prices.
| R&D case: This case assumes BOS and installation labor costs remain the same beyond 2050. Expanded case: BOS and labor costs decrease proportionally to the increase in module efficiency. |
| Impacts |
|
|
|
| References | (DOE, 2024) |
| Year | Module Efficiency | Inverter Power Electronics | Installation Efficiencies |
| 2030 | 🗨Technology Description: Efficiency of 24% is calculated using the weighted average of ITRPV projected efficiency and market shares of module technology types, with TOPCon constituting more than half the market.
R&D case: This scenario assumes a 35% reduction from the 2024 MMP for modules, resulting in $0.22/WDC. Expanded case: 2024 module price is projected to 2030 using 2/3 of the rate of decline observed during 2018–2024 (EIA, 2023), resulting in $0.25/WDC. 🗨 Justification: This scenario represents business as usual with a moderate short-term module efficiency-improvement expectation and a module price reduction following historical rates. | No change vs. 2024. | Technology Description: This scenario assumes 10% labor and hardware BOS cost improvements from the 2024 market price through module efficiencies, automation, and preassembly efficiencies (e.g., module mounting and wiring) and through higher labor productivity (e.g., through better workforce training) and access to advanced hardware technologies. Justification: This scenario represents lower levels of improvement compared to the long-term historical average (Ramasamy et al., 2025). |
| 2040 | Technology Description: ITRPV market shares and efficiencies are linearly extrapolated outward to 2040, and module efficiency is calculated using a weighted average approach, resulting in an efficiency of 26%.
R&D case: This scenario assumes a 55% reduction from the 2024 MMP for modules, resulting in $0.15/WDC. Expanded case: Module price decreases from 2030 by 1/2 of the U.S. Energy Information Administration (EIA) (EIA, 2023) rate observed during 2018–2024, reaching $0.18/WDC. Justification: This scenario represents business as usual with a moderate short-term module efficiency-improvement expectation and a module price reduction following historical rates. | Technology Description: This scenario assumes inverter design simplification and manufacturing automation as well as increased access in the market to advanced inverter technologies, resulting in an inverter price of $0.03/WDC. Justification: The power electronics industry already has roadmaps to simplify and automate current products, and there is more potential with increased industry size. | Technology Description: R&D case: This scenario assumes 35% labor and hardware BOS cost improvements from the 2024 market price through module efficiencies, automation, and preassembly efficiencies (e.g., module mounting and wiring). Expanded case: This scenario assumes 20% labor and hardware BOS cost improvements from the 2024 market price through better availability of labor and access to advanced hardware technologies. Justification: This scenario represents lower levels of improvement compared to the long-term historical average (Ramasamy et al., 2025). With increased global deployment and a more efficient supply chain, preassembly of module mounting and wiring is possible. |
| 2050 | Technology Description: Efficiency is calculated using the average of 2040 and 2060 Moderate case projected efficiencies, resulting in efficiency of 27%. R&D case: This case assumes a 65% reduction from the 2024 MMP for modules, resulting in $0.12/WDC. Expanded case: Module price reduces from 2040 by 1/4 of the EIA rate (EIA, 2023) observed during 2018–2024, resulting in $0.16/WDC. Justification: This scenario represents business as usual with a moderate short-term module efficiency-improvement expectation and a module price reduction following historical rates. | Technology Description: This scenario assumes inverter design simplification and manufacturing automation as well as increased access in the market to advanced inverter technologies, resulting in an inverter price of $0.028/WDC. Justification: The power electronics industry already has roadmaps to simplify and automate current products, and there is more potential with increased industry size.
| Technology Description: R&D case: This scenario assumes 40% labor and hardware BOS cost improvements from the 2024 market price through module efficiencies, automation, and preassembly efficiencies (e.g., module mounting and wiring). Expanded case: This scenario assumes 25% labor and hardware BOS cost improvements from the 2024 market price through better availability of labor and access to advanced hardware technologies. Justification: This scenario represents lower levels of improvement compared to the long-term historical average (Ramasamy et al., 2025). With increased global deployment and a more efficient supply chain, preassembly of module mounting and wiring is possible. Best practices for permitting interconnection and PV installation (e.g., subdivision regulations, new construction guidelines, and design requirements) are being developed. |
| 2060 | Technology Description: R&D case: This case assumes module costs remain the same beyond 2050, at $0.12/WDC. Expanded case: Assumes a lower end of module efficiency at 28%. Module price decreases from 2050 by 1/6 of EIA rate (EIA, 2023) observed during 2018–2024, resulting in a module price of $0.15/WDC. Justification: This scenario represents business as usual with a moderate short-term module efficiency-improvement expectation and a module price reduction following historical rates. | Technology Description: R&D case: This case assumes inverter costs remain the same beyond 2050, at $0.028/WDC. Expanded case: This scenario assumes increased access in the market to advanced inverter technologies, resulting in an inverter price of $0.026/WDC. Justification: The power electronics industry already has roadmaps to simplify and automate current products, and there is more potential with increased industry size and longer timelines. | Technology Description: R&D case: This scenario assumes labor and hardware BOS costs remain the same beyond 2050. 🗨 Expanded case: This scenario assumes 25% labor and hardware BOS cost improvements from the 2024 market price through better availability of labor and access to advanced hardware technologies. Justification: This scenario represents lower levels of improvement compared to the long-term historical average (Ramasamy et al., 2025). With increased global deployment and a more efficient supply chain, preassembly of module mounting and wiring is possible. Best practices for permitting interconnection and PV installation (e.g., subdivision regulations, new construction guidelines, and design requirements) are being developed. |
| Impacts |
|
|
|
| References |
| Year | Module Efficiency | Inverter Power Electronics | Installation Efficiencies |
| 2030 | Technology Description: This scenario assumes rapid improvements in module technology efficiency. Module efficiency uses ITRPV projected 2030 module efficiency with removal of PERC and increased tandem PV presence, resulting in a weighted average approach to a 2030 advanced module efficiency (25%).
R&D case: The MMP is adjusted for module efficiency improvements, combined with a 45% reduction in costs from manufacturing improvements, resulting in $0.16/WDC. Expanded case: The 2024 global module spot price ($0.10/WDC) and efficiency (21%) from (DOE, 2024) were adjusted for 2030 module efficiency, resulting in a module price of $0.08/WDC. Justification: This scenario represents a more aggressive technological scenario with rapid shifts to high-efficiency module technologies and, in the Expanded case, assumes access to global market pricing.🗨 | Technology Description: This scenario assumes inverter design simplification and manufacturing automation, and increased access in the market to advanced inverter technologies, resulting in an inverter price of $0.02/WDC. Justification: The power electronics industry already has roadmaps to simplify and automate current products, and there is more potential with increased industry size. | Technology Description: This scenario assumes a 30% reduction from 2024 prices in BOS equipment and installation labor costs. This is achieved through automation and preassembly efficiencies (e.g., module mounting and wiring), and through better availability of labor and access to advanced hardware technologies. The use of carbon fiber—which is assumed to have achieved low cost, replacing steel and aluminum—cuts mounting costs. R&D case: 2024 market price basis is used. Expanded case: 2024 minimum sustainable price basis is used. Justification: With increased global deployment and a more efficient supply chain, preassembly of PV module mounting and wiring is possible. Reduction of supply chain margins (e.g., profit and overhead charged by suppliers, manufacturers, distributors, and retailers) will likely occur as the U.S. PV industry grows and matures. In addition, streamlining of installation practices through improved workforce development and training and developing standardized PV hardware are assumed. |
| 2040 | Technology Description:🗨This scenario assumes rapid improvements in module technology efficiency. Module efficiency uses ITRPV projected efficiency extrapolated to 2040 and significant market growth of tandem PV technology because of advances in degradation rates and manufacturing techniques. This results in a weighted average approach to a 2040 advanced module efficiency (28%).
R&D case: The MMP is adjusted for module efficiency improvements, combined with a 50% reduction in costs from manufacturing improvements, resulting in $0.13/WDC. Expanded case: The 2024 global module spot price ($0.10/WDC) and efficiency (21%) from (DOE, 2024) are adjusted for 2040 module efficiency, resulting in a module price of $0.07/WDC. Justification: This scenario represents a more aggressive technological scenario with rapid shifts to high-efficiency module technologies and, in the Expanded case, assumes access to global market pricing. | Technology Description: This scenario assumes inverter design simplification and manufacturing automation, and increased access in the market to advanced inverter technologies, resulting in an inverter price of $0.02/WDC. Justification: The power electronics industry already has roadmaps to simplify and automate current products, and there is more potential with increased industry size.
| Technology Description: This scenario assumes a 40% reduction from 2024 prices in BOS equipment and installation labor costs. This is achieved through automation and preassembly efficiencies (e.g., module mounting and wiring), and through better availability of labor and access to advanced hardware technologies. The use of carbon fiber—which is assumed to have achieved low cost, replacing steel and aluminum—cuts mounting costs. R&D case: 2024 market price basis is used. Expanded case: 2024 minimum sustainable price basis is used. Justification: The types of technology improvements are similar to those for the 2030 Scenario above, with similar justification but more aggressive.
|
| 2050 | Technology Description: Module efficiency (30%) is the average between 2040 and 2060 projected efficiency values. R&D case: The MMP is adjusted for module efficiency improvements, combined with a 55% reduction in costs from manufacturing improvements, resulting in $0.10/WDC. Expanded case: The 2024 global module spot price ($0.10/WDC) and efficiency (21%) from (DOE, 2024) are adjusted for 2050 module efficiency, resulting in a module price of $0.07/WDC. Justification: This scenario represents a more aggressive technological scenario with rapid shifts to high-efficiency module technologies and, in the Expanded case, assumes access to global market pricing. | Technology Description: This scenario assumes inverter design simplification and manufacturing automation, and increased access in the market to advanced inverter technologies, resulting in an inverter price of $0.02/WDC. Justification: The power electronics industry already has roadmaps to simplify and automate current products, and there is more potential with increased industry size.
| Technology Description: This scenario assumes a 50% reduction from 2024 prices in BOS equipment and installation labor costs. This is achieved through automation and preassembly efficiencies (e.g., module mounting and wiring), and through better availability of labor and access to advanced hardware technologies. The use of carbon fiber—which is assumed to have achieved low cost, replacing steel and aluminum—cuts mounting costs. R&D case: 2024 market price basis is used. Expanded case: 2024 minimum sustainable price basis is used. Justification: The types of technology improvements are similar to those for the 2040 Scenario above, with similar justification but more aggressive. |
| 2060 | Technology Description: R&D case: This case assumes module costs remain the same beyond 2050, at $0.10/WDC. Expanded case: This scenario assumes rapid improvements in module efficiency as well as new technologies entering the market. National Laboratory of the Rockies (NLR) internal analysis projected the potential technology market share and module efficiency of a 2060 market (Kirstin Alberi et al., 2024); (Thomas G. Allen et al., 2024), resulting in a weighted average approach to a 2060 advanced module efficiency (32%).
The 2024 global module spot price ($0.10/WDC) and efficiency (21%) from (DOE, 2024) are adjusted for 2060 module efficiency, resulting in a module price of $0.06/WDC. Justification: This scenario represents a more aggressive technological scenario with rapid shifts to high-efficiency module technologies and, in the Expanded case, assumes access to global market pricing. | Technology Description: R&D case: This case assumes that inverter costs remain the same beyond 2050, at $0.02/WDC. Expanded case: This scenario assumes increased access in the market to advanced inverter technologies, resulting in an inverter price of $0.01/WDC. Justification: The power electronics industry already has roadmaps to simplify and automate current products, and there is more potential with increased industry size.
| Technology Description: R&D case: This case assumes that BOS and installation labor costs remain the same beyond 2050. Expanded case: This scenario assumes a 55% reduction from 2024 minimum sustainable prices in BOS equipment and installation labor costs, through better availability of labor and access to advanced hardware technologies. A significant step change in the use of emerging technologies impacts the reduction of system costs. Justification: Innovative technologies enter the market, increasing system efficiency and decreasing costs.
|
| Impacts |
|
|
|
| References | (DOE, 2024) |
Scenario Assumptions
The technology improvement scenarios are used to project CAPEX for utility-scale PV with linear interpolation between each target year, which results in CAPEX changes as described in the tables below.
R&D Case CAPEX Changes
| Year | Conservative Scenario | Moderate Scenario | Advanced Scenario | |||
| Total | Per Year | Total | Per Year | Total | Per Year | |
| 2024–2030 | -11% | -1.9% | -24% | -4.4% | -41% | -8.4% |
| 2030–2040 | -4% | -0.4% | -28% | -3.2% | -21% | -2.3% |
| 2040–2050 | -2% | -0.2% | -14% | -1.5% | -16% | -1.8% |
| 2050–2060 | 0% | 0% | 0% | 0% | 0% | 0% |
🗨
Expanded Case CAPEX Changes
| Year | Conservative Scenario | Moderate Scenario | Advanced Scenario | |||
| Total | Per Year | Total | Per Year | Total | Per Year | |
| 2024–2030 | 13% | 2.0% | -21% | -3.8% | -50% | -10.8% |
| 2030–2040 | -3% | -0.3% | -19% | -2.0% | -19% | -2.1% |
| 2040–2050 | -3% | -0.3% | -11% | -1.2% | -14% | -1.5% |
| 2050–2060 | -3% | -0.3% | -4% | -0.4% | -13% | -1.4% |
Although we did not create our CAPEX projections based on rates of deployment, utility-scale PV deployment is expected to increase substantially over our analysis period. For example, in the National Laboratory of the Rockies's (NLR's) Standard Scenarios Mid-case (which uses CAPEX assumptions from the 2023 ATB), U.S. utility-scale PV deployment grows by 192% between 2024 and 2035 (from 148 gigawatts [GW] to 432 GW) and by 113% between 2035 and 2050 (from 432 GW to 922 GW) (Gagnon et al., 2024).
Representative Technology
Utility-scale PV systems in the 2025 ATB represent 100-megawatts direct current (MWDC/ 75.8-MWAC [alternating current]) one-axis tracking systems with performance and pricing characteristics consistent with bifacial modules and a DC-to-AC ratio, or inverter loading ratio (ILR), of 1.32 for the Base Year and future years (DOE, 2024). We recognize ILR is likely to change, particularly with the adoption of bifacial modules, and to greatly depend on location. However, allowing for this change would require the optimization of ILR and CAPEX by resource bin and year, causing a range of prices, independent of other regional factors. We believe this would create less transparency and more confusion regarding the impact of technology changes on these individual levelized cost of energy (LCOE) categories.
Methodology
This section describes the methodology to develop assumptions for CAPEX, O&M, and capacity factor. For standardized assumptions, see regional cost variation, materials cost index, scale of industry, policies and regulations, and inflation. The PV-specific and standardized assumptions for labor cost differ; the PV analysis assumes the use of nonunion labor only.
🗨Although CAPEX is one driver of lower costs, R&D efforts continue to focus on other areas to lower the cost of energy from utility-scale PV, such as longer system lifetime and improved performance. Three projections are developed for scenario modeling as bounding levels (see the Scenario Descriptions section of this page).
Capital Expenditures (CAPEX)
Definitions: The rated capacity used to calculate CAPEX for PV systems is reported in terms of the aggregated capacity of either all its modules or all its inverters. PV modules are rated using standard test conditions and produce DC energy; inverters convert DC energy/power to AC energy/power. Therefore, the capacity of a PV system is rated either in units of MWDC via the aggregation of all modules' rated capacities or in units of MWAC via the aggregation of all inverters' rated capacities. The ratio of these two capacities is referred to as the ILR. The 2025 ATB assumes the Base Year estimates and future projections use an ILR of 1.32 (DOE, 2024).
The PV industry typically refers to PV CAPEX in units of $/kWDC based on the aggregated module capacity. The electric utility industry typically refers to PV CAPEX in units of $/kWAC based on the aggregated inverter capacity; starting with the 2020 ATB, we use $/kWAC for utility-scale PV.
Plant costs are represented with a single estimate per innovation scenario because CAPEX does not correlate well with solar resources.
For the 2025 ATB—and based on the U.S. Department of Energy (DOE) PV System Cost Benchmark (DOE, 2024)—the utility-scale PV plant envelope is defined to include items noted in the Components of CAPEX table below.
Base Year: An overnight capital cost (includes grid connection cost) of $1.62/WAC in 2023 is based on modeled pricing for a 100-MWDC, one-axis tracking system quoted in Q1 2023 adjusted from $/WDC to $/WAC by an ILR of 1.34 (Ramasamy et al., 2023). The $1.49/WAC overnight capital cost (plus grid connection cost) in 2024 is based on modeled pricing for a 100-MWDC, one-axis tracking system quoted in Q1 2024 as reported by (DOE, 2024), adjusted by an ILR of 1.32.
We focus on these system sizes to align with recent trends in utility-scale installations. (Joachim Seel et al., 2024) reported 221 PV installations (greater than 5 MWAC in capacity) totaling 18.5 GWAC were placed in service in 2023 in the United States; this represents an average of approximately 84 MWAC.
In the historical trends chart at the top of this page, reported historical utility-scale PV plant CAPEX (Joachim Seel et al., 2024) is shown in box-and-whiskers format for comparison to the historical benchmarked and future CAPEX projections for utility-scale PV plants. (Joachim Seel et al., 2024) provide statistical representation of CAPEX for projects larger than 5 MWAC.
Reported and benchmarked prices can differ for various reasons, as outlined by Barbose and Darghouth (Barbose et al., 2019); Bolinger, Seel, and Robson (Bolinger et al., 2019); and Ramasamy et al. (Ramasamy et al., 2022), including the following:
- Timing-Related Issues: For example, the time between power purchase agreement contract completion and project placement in service can vary, and a system can be reported as being installed in separate sections over time or when an entire complex is complete. For example, in 2014, the reported capacity-weighted average system price was higher than 80% of system prices in 2014 because very large systems with multiyear construction schedules were being installed that year. Developers of these large systems negotiated contracts and installed portions of their systems when module and other costs were higher.
- System Variations: The size, technology, installer margin, and design of systems installed in a given year vary over time.
- Cost Categories: There are variations in which cost categories are included in CAPEX (e.g., financing costs and initial O&M expenses).
When federal investment tax credits are taken, they provide an incentive to include costs in the upfront CAPEX to receive a higher tax credit; these included costs might have otherwise been reported as operating or financing costs. The bottom-up benchmarks are more reflective of an overnight capital cost, which is consistent with the ATB methodology of inputting overnight capital costs and calculating construction financing to derive CAPEX.
Use the following table to view the components of CAPEX.
Future Years
Projections of utility-scale PV plant CAPEX for future years 2030, 2040, 2050, and 2060 are based on bottom-up cost modeling, with 2024 values from (DOE, 2024) and a straight-line change in price in the intermediate years between each pivot year. ILR is assumed to remain at a constant 1.32. The assumptions for the R&D cost drivers and Expanded cost drivers cases vary, producing different results. The system design and price changes made in the models are summarized and described in the Summary of Technology Innovations by Scenario table. See below for the details of changes to components of system price in the various ATB scenarios.
The values in the chart above represent overnight capital costs, which exclude construction financing costs.
We assume a straight-line change in price in the years between 2024 and 2030, between 2030 and 2040, between 2040 and 2050, and between 2050 and 2060.
We compare the CAPEX scenarios over time to three analyst projections—one from the U.S. Energy Information Administration (EIA) and two from private analysts—adjusted for inflation and ILR. The median of the private projections is displayed in the figure below through 2030, along with the EIA projection through 2050. The 2025 ATB Moderate Scenario CAPEX projections generally align with the analyst projections shown.
Sources: 2025 ATB; (DOE, 2024); (Wood Mackenzie, 2023); (Wood Mackenzie, 2024); (EIA, 2023); (BNEF, 2024); (Ramasamy et al., 2023); (Joachim Seel et al., 2024).
All prices quoted in WDC are converted to WAC (1 WAC = ILR × WDC).
Operation and Maintenance (O&M) Costs
Definition: O&M costs represent the annual fixed expenditures required to operate and maintain a PV plant over its lifetime, including items noted in the table below.
Base Year: The O&M cost of $23/kWAC-yr in 2023 is based on modeled pricing for a 100-MWDC, one-axis tracking system quoted in Q1 2023 as reported by (Ramasamy et al., 2023), adjusted from DC to AC. Lawrence Berkeley National Laboratory collected feedback on O&M costs from U.S. solar industry professionals (Wiser et al., 2020). The wide range in reported prices depends in part on the range in maintenance practices for various systems and on cost categories that include asset management (including compliance and reporting for incentive payments), insurance products, site security, cleaning, vegetation removal, and component failure. Not all these practices are performed for each system, and some factors depend on the quality of the parts and construction.
Future Years: The fixed O&M (FOM) cost of $24.66/kWAC-yr for 2024 is based on pricing reported by (DOE, 2024), which can be divided into system-related expenses ($10.88/kWAC-yr), property-related expenses ($11.41/kWAC-yr), and administration-related expenses ($2.38/kWAC-yr). From 2024 to 2060, system-related FOM is based on the ratio of system-related O&M costs ($/kW-yr) to CAPEX costs ($/kW) of 0.74:100 in 2024, as reported by (DOE, 2024). This ratio is lower than the ratio of O&M costs to historically reported CAPEX costs of 0.85:100, which is derived from 2011–2023 historical data reported by (Joachim Seel et al., 2024), and the ratio of O&M costs to CAPEX costs of 0.9:100, which is derived from (IEA, 2024). Historically reported data suggest O&M and CAPEX cost reductions are correlated; from 2011 to 2023, fleetwide average O&M and CAPEX costs fell 67% and 73%, respectively, as reported by (Joachim Seel et al., 2024). From 2024 to 2060, property-related expenses are reduced by the inverse ratio of the increase in module efficiency because less space will be required on a per watt basis. Administrative expenses are kept constant.
Capacity Factor
Definition: The capacity factor represents the expected annual average energy production divided by the annual energy production 🗨and assumes the plant operates at rated capacity for every hour of the year. It is intended to represent a long-term average over the lifetime of the plant; it does not represent interannual variation in energy production. Future year estimates represent the estimated annual average capacity factor over the technical lifetime of a new plant installed in a given year.
PV system inverters, which convert DC energy/power to AC energy/power, have AC capacity ratings; therefore, the capacity of a PV system is rated in units of MWAC, or the aggregation of all inverters' rated capacities, or MWDC, or the aggregation of all modules' rated capacities. Other technologies' capacity factors are represented exclusively in AC units; however, in some previous editions of the ATB, PV pricing is represented in $/kWDC. In the 2025 ATB, utility-scale PV (though not commercial PV or residential PV) is represented in $/kWAC; for this reason, values in the 2025 ATB are not directly comparable to values in the 2019 ATB or previous editions of the ATB without adjusting previous versions from WDC to WAC.
The capacity factor is influenced by the hourly solar profile, technology (e.g., thin-film or crystalline silicon), the bifaciality of the module, albedo, axis type (i.e., none, one, or two), shading, expected downtime, ILR, and inverter losses to transform from DC power to AC power. The ILR (DC-to-AC ratio) is a design choice that influences the capacity factor. The baseline PV plant capacity factor incorporates an assumed degradation rate of 0.7%/yr in the annual average calculation. R&D could increase energy yield through bifaciality, improved albedo, better soil removal, improved cell temperature, lower system losses, O&M practices that improve uptime, and lower degradation rates of PV plant capacity factor.
From 2007 to 2023, the cumulative median AC capacity factor for utility-scale U.S. projects installed at the time (for single-axis tracking systems) was 25%, but individual project-level capacity factors exhibited a wide range (7%–35%) (Joachim Seel et al., 2024). The reported U.S. system capacity factors encompass the range of estimated capacity factors in the 2025 ATB (first year capacity factors of 21.1%–33.5% in 2021; see the Resource Categorization section above). The figure below shows historical data for capacity factor as a function of ILR, solar resource, and mounting type.
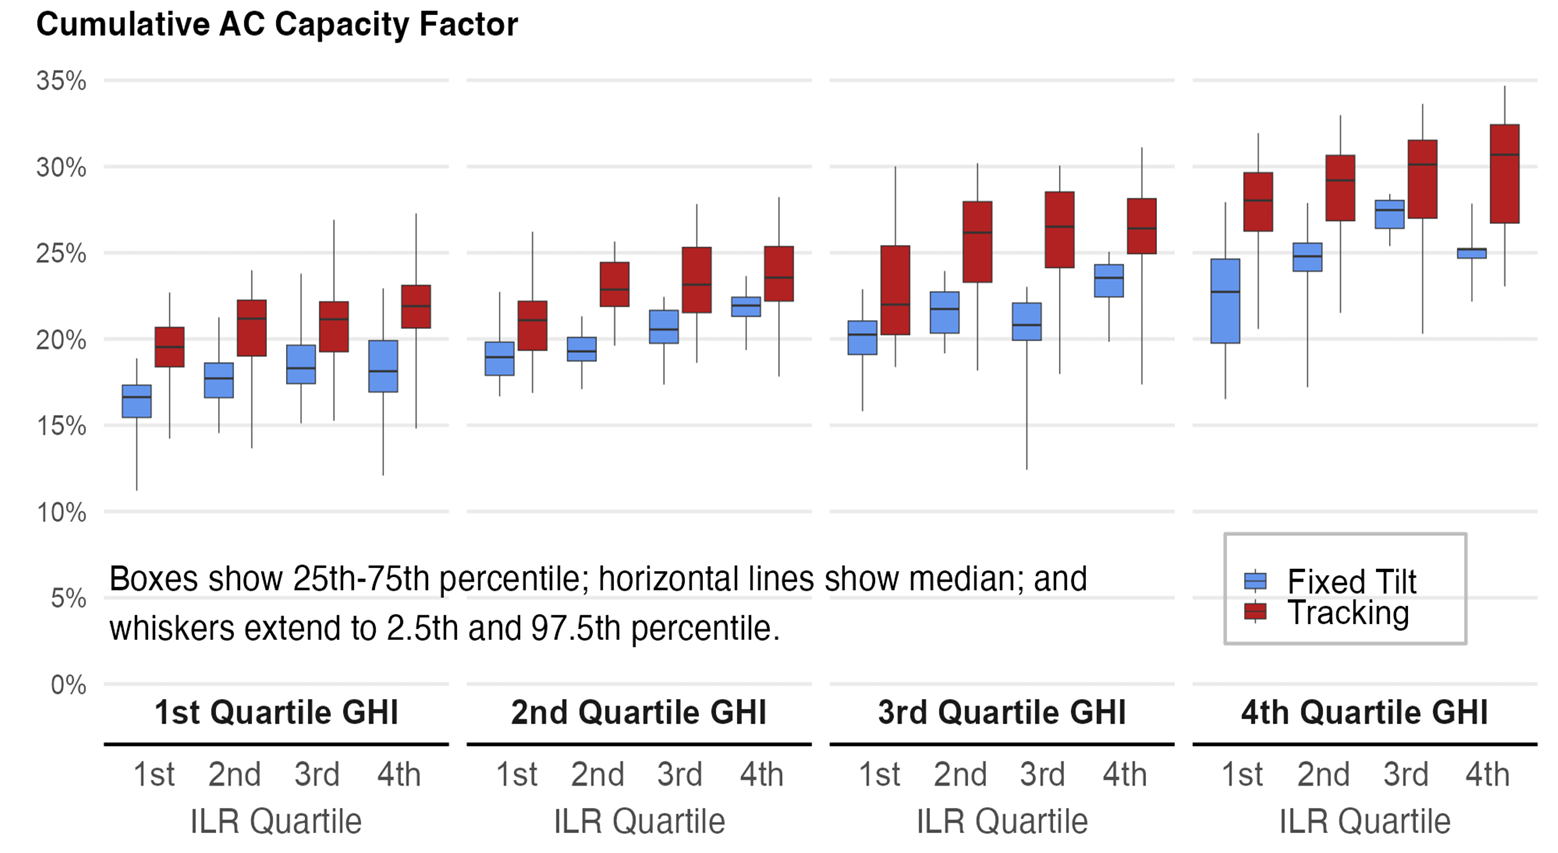
Source: (Joachim Seel et al., 2024)
Over time, PV plant output is reduced by the degradation rate of 0.7%/yr. This degradation is accounted for in ATB estimates of capacity factor (see table below). The 2025 ATB capacity factor estimates represent estimated annual average energy production over a 30-year lifetime.
These AC capacity factors are for a one-axis tracking system with a DC-to-AC ratio of 1.32 and are therefore not representative of the lower capacity factors reported by fixed-tilt systems.
Base Year: In the interactive data chart at the top of this page, select Technology Detail = All to add filters to display a range of capacity factors based on variation in solar resource in the contiguous United States. The range of the Base Year estimates illustrates the effect of locating a utility-scale PV plant in places with lower or higher solar irradiance. The ATB provides the average capacity factor for 10 resource categories in the United States, binned by mean GHI. Average capacity factors are calculated using county-level capacity factor averages from the reV model for 1998–2021 (inclusive) of the NSRDB.
The NSRDB provides modeled spatiotemporal solar irradiance resource data at 4-km spatial resolution and 0.5-hour temporal resolution. The county-level mean GHI is calculated by aggregating each NSRDB point’s multiyear mean GHI to provide the county’s mean GHI for all years included in the analysis. The U.S. average capacity factor for each resource category is weighted by the land area (square miles) of each county within the GHI resource category. The county-estimated land area is provided by geospatial and tabular data from the U.S. Census.
Because of the methodology for calculating capacity factors in the 2025 ATB, capacity factors are not directly comparable to those in some previous editions of the ATB; we now calculate them by adjusting the 2021 ATB capacity factors with ILR = 1.32. In the 2025 ATB, we use capacity factors ranging from 19.4% for Class 10 (for locations with an average annual GHI less than 3.75) to 31.5% for Class 1 (for locations with an average annual GHI greater than 5.75) in 2023.🗨
Future Years: Projections of capacity factors for plants installed in future years increase over time because of an increase in energy yield from the module (better tracking, improved cell temperature, and bifaciality), reduced system losses (improved soil removal, improved O&M uptime, and more-efficient inverters), and a reduction in degradation rates. These projections do not account for factors such as the potential need to increase PV curtailment or use less-favorable sites as PV deployment increases in the future. The table below summarizes the technology improvements we use to calculate indicative improvements in capacity factor in each scenario.
| Performance Area | 2021* | 2035, Conservative Scenario | 2035, Moderate Scenario | 2035, Advanced Scenario |
|---|---|---|---|---|
| Bifaciality factor | 0.65 | 0.65 | 0.85 | 0.85 |
| DC losses | 14.1% | 14.1% | 10.4% | 7.5% |
| Inverter efficiency | 96% | 96% | 98% | 98% |
| Annual degradation rate | 0.7% | 0.7% | 0.5% | 0.2% |
* The year 2021 is used here because improvement assumptions are not changed from the 2022 ATB with a base year of 2021.
The technology improvements summarized above would not necessarily result in the estimated capacity factor improvements, given the 2025 ATB assumption of a constant ILR of 1.32. PV system ILR choice is based on an optimization exercise to maximize profits (or offer the lowest energy price), trading off the extra costs and increased clipping losses of additional modules with improvements in inverter operation and a higher, flatter electricity production curve. All things being equal, the optimal ILR of PV systems in higher resource classes or for those that use bifacial modules will be lower than the optimal ILR of systems in lower resource classes or for those with monofacial modules—particularly without the use of energy storage.
Because of the complexity of optimizing CAPEX and ILR for each resource class for each year, and with and without storage, ATB PV system CAPEX and capacity factor benchmarks are calculated using a fixed ILR of 1.32, independent of system location, performance improvements over time, or the incorporation of storage. In addition, we assume performance improvements over time are not location-dependent even though a PV system with the same ILR in a higher-resource area will experience more clipping and thus fewer performance improvements. However, in reality, PV systems in those areas would reduce their clipping losses by installing fewer PV panels and would thus have a lower upfront cost (trading off the marginally greater production with reduced CAPEX).
The following table summarizes the difference in average capacity factor in 2035 caused by these changes in the three technology innovation scenarios. We assume each scenario's 2050 capacity factor is the equivalent of the 2035 capacity factor of the scenario but one degree more aggressive, with a straight-line change in the intermediate years between 2035 and 2050. After 2050, the capacity factor remains constant in all scenarios.
| Scenario | Average Capacity Factor in 2035 (Class 10–Class 1) | Percentage Improvement From Base Year (2023) |
|---|---|---|
| Advanced Scenario | 22.7%–35.2% | 11.7%–14% |
| Moderate Scenario | 20.5%–33.3% | 6.7%–8.3% |
| Conservative Scenario | 19.4%–30.9% | 0.0% |
We also develop and model a scenario one degree more aggressive than the Advanced Scenario to estimate capacity factors in 2050, which is constant until 2060. In the Advanced Scenario, the capacity factors in 2050 are assumed to have more than 22.7% improvement over 2023 capacity factors.
References
The following references are specific to this page; for all references in this ATB, see References.