Distributed Wind
Resource Categorization
The U.S. Department of Energy's (DOE's) Wind Energy Technologies Office defines distributed wind in terms of technology application, based on a wind plant's location relative to end use and power distribution infrastructure, rather than technology or project size. The following wind system attributes are used by the office to characterize them as distributed:
- Proximity to end use: Wind turbines are installed at or near the point of end use to meet on-site energy demand or support the operation of the existing distribution grid.
- Point of interconnection: Wind turbines are connected on the customer side of the meter (also known as behind-the-meter), are connected directly to the distribution grid (also known as front-of-the-meter), or are part of a microgrid.
Distributed wind energy systems are commonly installed on, but are not limited to, residential, agricultural, commercial, industrial, and community sites and can range in size from a 1-kilowatt (kW) turbine at a home to multimegawatt turbines at a manufacturing facility or connected to a local distribution system.
Distributed wind project performance and cost are represented using four turbine technology classes: residential, commercial, midsize, and large. When used in the context of wind turbine technology, these labels refer to the size of the turbines. Notably, any turbine size may be installed at the consumer’s site, independent of sector (residential, commercial, or industrial), with the applicability of a specific turbine being governed by both the ability to site a given machine on a specific parcel of land and the consumer’s load (Lantz et al., 2016).

| Turbine Technology Class | Machine Rating (kW) | Hub Height (meters [m]) |
| Residential | <21 | 30 |
| Commercial | 21–100 | 40 |
| Midsize | 101–1000 | 60 |
| Large | >1,000 | 80 |
For distributed wind, similar to land-based utility-scale wind, each of the potential wind sites characterized in the Annual Technology Baseline (ATB) is associated with 1 of 10 wind speed classes. The following table shows each resource class as well as the resulting mean wind speed ranges that define each class. Wind Speed Classes 1–10 sweep a range of average annual wind speeds that distributed wind projects can be expected to have in the contiguous United States. Wind Speed Class 1 suggests a resource-rich wind site that is most attractive for wind project development, and Wind Speed Class 10 represents a less favorable wind resource site.
| Wind Class | Average Annual Wind Speed at 110 m Above Ground | Shear | Weibull K Factor |
|---|---|---|---|
| 1 | 9.52 | 0.14 | 2 |
| 2 | 8.87 | 0.14 | 2 |
| 3 | 8.66 | 0.14 | 2 |
| 4 | 8.45 | 0.14 | 2 |
| 5 | 8.2 | 0.14 | 2 |
| 6 | 7.84 | 0.14 | 2 |
| 7 | 7.36 | 0.14 | 2 |
| 8 | 6.8 | 0.14 | 2 |
| 9 | 6.21 | 0.14 | 2 |
| 10 | 5.13 | 0.14 | 2 |
Scenario Descriptions
Given the highly localized nature of the techno-economic performance of a distributed wind project, estimating future capital costs and other trends is challenging. The current status of the industry coupled with substantial uncertainty in terms of future demand and deployment at the global level add to the challenge. The costs modeled here reflect an initial assessment but also a rigorous analytical estimate. Given the uncertainty in this domain, a broad range of values is created to support scenario analysis.
A summary of the capital expenditures (CAPEX) reductions is provided in the table below (Summary of Technology Innovation by Scenario). CAPEX learning rates between 2023 and 2035 are intended to reflect the near-term innovation potential paired with each scenario. Learning beyond 2035 is reduced when compared to the near term but still results in percent reduction of CAPEX.
| Scenario | Innovations |
| Conservative Scenario | Limited adoption of technology innovation |
| Moderate Scenario | Standardized zoning, permitting, interconnection, and incentives Moderate volume of turbine manufacturing leading to lower overhead charged per wind turbine |
| Advanced Scenario | Fully integrated zoning, permitting, interconnection, and incentives increase efficiencies and streamline processes High volume of turbine manufacturing significantly reduces overhead charged per wind turbine |
Scenario Assumptions
The cost reduction pathways for the distributed wind scenarios are developed from a combination of published literature, prior techno-economic analyses, and utility-scale land-based wind technology. Learning rates are applied to predict CAPEX and operating expenses (OPEX) reduction according to the following equation:
$$ \text{% reduction} = \text{no. of doublings} \times \text{learning rate (LR)} $$
Short-term cost estimates inform Base Year analysis (Stehly et al., 2023). Reductions are then derived from land-based wind median learning rates and projected global growth rates (DNV, 2024).
Summary of Cost Reduction Assumptions by Scenario
| Scenario | Description |
| Conservative Scenario |
|
| Moderate Scenario |
|
| Advanced Scenario |
|
Values presented in the table are for the commercial-scale wind turbine; different levels of cost reduction are assumed for the other distributed wind turbine scales (i.e., residential, midsize, and large).
Representative Technology
Results for distributed wind detailed in the ATB are contingent on a detailed characterization or representation of distributed wind technologies. Estimates of addressable resource potential require knowledge of potential hub heights and energy generation for wind turbines ranging from kilowatt- to megawatt-scale. The technology characterizations—such as turbine rating, hub height, and rotor diameter for the baseline scenarios—are summarized in the following table. These characteristics represent somewhat recent (2019) technology, as informed by empirical data and certified wind turbine equipment (Bhaskar and Stehly, 2021).
To obtain current and future cost and performance estimates, the technology representations for the Base Year (2023) and Mid-Year (2035) are defined. For a detailed breakdown of current and future distributed wind turbine performance, including current and future representative power curves, see Appendix B of the Distributed Wind Energy Futures Study 2022 (McCabe et al., 2022). The turbine performance improvements through 2060 remain the same across all three scenarios (Conservative, Moderate, and Advanced). Existing literature on the future performance improvements of distributed wind turbines does not categorize the performance improvements by various scenarios, resulting in single performance improvement trajectories for all four turbine classes (DOE, 2015) and (Lantz et al., 2016).
In contrast to land-based utility-scale wind, distributed wind projects tend to be single-turbine projects (though projects can have more than one turbine). The technological advances seen in multiturbine utility-scale projects primarily revolve around advances in plant-level improvements in energy production because of plant-level design and optimization. As a result, most technological innovations in utility-scale wind do not translate to distributed wind projects.
| Project Scale Classification | Turbine Rating (kW) | Hub Height (m) | Rotor Diameter (m) | Specific Power | Max Coefficient of Performance (Cp) | Max Tip Speed (meters per second [m/s]) | Max Tip-Speed Ratio |
|---|---|---|---|---|---|---|---|
| Residential | 20 | 30 | 12.4 | 166 | 0.4 | 95 | 9.7 |
| Commercial | 100 | 40 | 27.6 | 167 | 0.5 | 75 | 8 |
| Midsize | 650 | 60 | 70 | 169 | 0.5 | 70 | 8 |
| Large | 1,500 | 80 | 107 | 167 | 0.5 | 82 | 8 |
The 2025 ATB does not assume change over time with respect to turbine characteristics such as hub height and rotor diameter, given uncertainty regarding future technology configurations. That said, turbine reliability is assumed to improve over time, leading to reduced losses and better machine performance in all scenarios.
Methodology
This section describes the methodology to estimate current and future CAPEX, operations and maintenance (O&M), and capacity factor. The current and future cost and performance estimates assume a single-turbine project across all four turbine technology classes, which is consistent with current project sizes seen in literature (Bhaskar and Stehly, 2021). We use a combination of technology learning rates and estimated global growth rates to identify potential changes in estimated levelized cost of energy (LCOE) (Lantz et al., 2016). The resulting LCOE trajectories are used in conjunction with future performance and O&M characterizations and with constant financing terms to calculate capital costs (McCabe et al., 2022).
Capital Expenditures (CAPEX)
The 2024 ATB projection of Moderate Scenario CAPEX in 2023 is inflated to 2023 dollars and used as a base year estimate in the 2025 ATB. These cost estimates were initially informed by the National Laboratory of the Rockies's (NLR's) 2022 Cost of Wind Energy study (Stehly et al., 2023) and the Distributed Wind Energy Futures Study (McCabe et al., 2022). The 2025 ATB includes two sets of cost data with diverging CAPEX, referred to as Research and Development (R&D) Costs and Expanded Costs data. Because the former applies R&D improvements to the market and supply chain conditions of the Base Year, we model a decrease in CAPEX over time with respect to Base Year estimates. Alternatively, the Expanded Costs case accounts for changing market and supply chain conditions. To model this case, CAPEX increases directly following the Base Year because of supply chain stress, high commodity prices, and increased logistics costs. These near-term factors are accounted for by applying an average CAPEX multiplier of 10% in 2024 and 5% in 2025, relative to 2023 costs.
Components of the CAPEX for a representative distributed wind project of any scale are summarized in (McCabe et al., 2022) and (Bhaskar and Stehly, 2021).
| Cost Type | Cost Component |
|---|---|
Turbine CAPEX | Turbine (price to installer) |
| Tower (price to installer) | |
| Other turbine equipment costs | |
| Original equipment manufacturer's extended warranty | |
| Transport to customer | |
Balance-of-system CAPEX | Zoning, permitting, interconnection, and incentives |
| Engineering and design | |
| Management (e.g., project and construction management) | |
| Turbine foundation | |
| Site preparation | |
| Grid connection | |
| Collection system | |
| Turbine erection and installation | |
| Development costs |
In the ATB, CAPEX reflects typical plants and does not include differences in regional costs associated with labor, materials, taxes, or system requirements. The CAPEX estimations calculated here are for single-turbine projects across all four project scales. Distributed wind projects range from 1 kW in size to multimegawatt turbines. Accordingly, distributed wind projects can have multiple turbines within the same project, although the likelihood of multiple turbines in a project is higher for midsize and large-scale projects (as opposed to residential and commercial-scale projects). Estimating the cost of multiturbine distributed wind projects is beyond the scope of this ATB analysis. For a detailed assessment of multiturbine midsize and large projects, refer to (Bhaskar and Stehly, 2021).
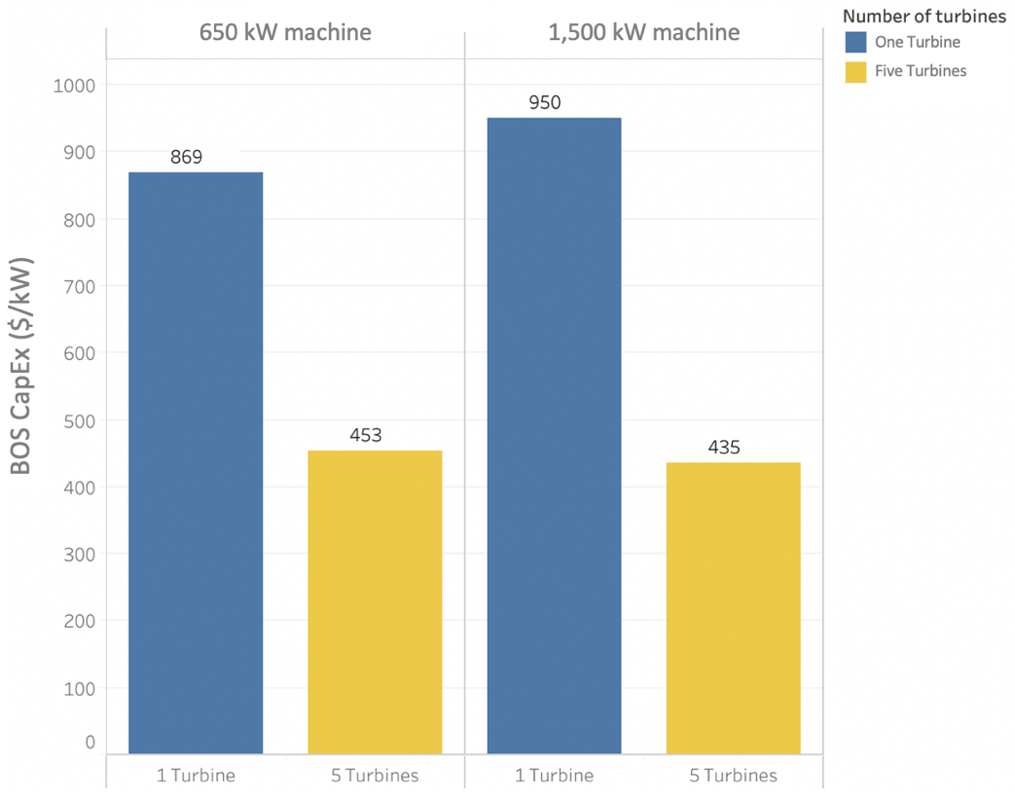
Source: (Bhaskar and Stehly, 2021)
Operation and Maintenance (O&M) Costs
Definition: O&M costs represent the all-in fixed and variable expenditures required to operate and maintain a distributed wind project. OPEX remains the same between the R&D and Expanded Costs cases. For a detailed breakdown of the components of the O&M cost bucket, review the O&M section of the Land-Based Wind page of the ATB.
Base Year: The all-in O&M costs of $41/kW-yr in the Base Year for all four project scales correspond to O&M in the 2022 Cost of Wind Energy Review, with adjustments for inflation (Stehly et al., 2023).
Future Years: O&M costs are assumed to decline consistently across turbine sizes by a cumulative 17% in the Moderate case (an average annual rate of approximately 0.5% per year) between 2023 and 2060.
Capacity Factor
Definition: Similar to land-based wind, the capacity factor for a distributed wind project is influenced by the project's generation profile, expected downtime, and energy losses within the wind plant. The specific power (i.e., ratio of machine rating to rotor-swept area), hub height, and use of stall-regulated or pitch-regulated machine are design choices that influence the capacity factor.
To calculate the Base Year and future capacity factors, an idealized power curve is developed for each current and future representative technology in the System Advisor Model (SAM) and is run for each of the weighted average wind speeds in each wind speed class. The capacity factors are calculated at the representative turbine hub height by extrapolating the wind speed up or down from the referenced 110-meter (m), above-ground-level, long-term average hourly wind resource data from the Wind Integration National Dataset (WIND) Toolkit. Loss estimates were updated in the 2025 ATB to reflect ongoing modeling work in the distributed wind research community (Sheridan et al., 2024).
The following chart shows a range of capacity factors based on variation in the resource for distributed wind projects in the contiguous United States and the future capacity factor estimates for the Conservative, Moderate, and Advanced Scenarios.
References
The following references are specific to this page; for all references in this ATB, see References.