Utility-Scale Battery Storage
The battery storage technologies do not calculate levelized cost of energy (LCOE) or levelized cost of storage (LCOS) and so do not use financial assumptions. Therefore, all parameters are the same for the research and development (R&D) and Markets & Policies Financials cases.
The 2025 Annual Technology Baseline (ATB) represents cost and performance for battery storage with durations of 2, 4, 6, 8, and 10 hours. It represents lithium-ion batteries (LIBs), with specific costs based on lithium iron phosphate (LFP) battery cells.
Base Year costs for utility-scale battery energy storage systems (BESS) are based on a bottom-up cost model using the data and methodology for utility-scale BESS in (Cole et al., 2025). The bottom-up BESS model accounts for major components, including the LIB pack, the inverter, and the balance of system (BOS) needed for the installation. Using the detailed cost models for LIB, we develop Base Year costs for a 60-megawatt (MW) BESS with storage durations of 2, 4, 6, 8, and 10 hours. Base Year installed capital costs for BESS decrease with duration (for direct storage, measured in $/kilowatt-hour [kWh]), whereas system costs (in $/kilowatt [kW]) increase. This inverse behavior is observed for all energy storage technologies and highlights the importance of distinguishing the two types of battery capacity (energy and power) when discussing the cost of energy storage.
Scenario Descriptions
Battery cost and performance projections in the 2025 ATB are based on a literature review of 16 sources published in 2023, 2024, and early 2025, as described by Cole et al. (Cole et al., 2025). Three projections for 2023 to 2050 are developed for scenario modeling based on this literature. In all cases, the projection from 2050 through 2060 is extrapolated from the pre-2050 cost reductions, assuming the rate of decline from 2050 through 2060 is half the rate of decline from 2035 to 2050.
In the three scenarios described below, costs of battery storage are anticipated to continue to decline over the long term. The Storage Futures Study (Augustine and Blair, 2021) describes how a greater share of this cost reduction comes from the battery pack cost component with fewer cost reductions in BOS, installation, and other components of the cost. The Storage Futures Study report indicates the National Laboratory of the Rockies (NLR), BloombergNEF (BNEF), and others anticipate the growth of the overall battery industry—across the consumer electronics sector, the transportation sector, and the electric utility sector—will lead to cost reductions in the long term. In the short term, some analysts expect flat or even increasing pricing for battery storage. In addition, BNEF and others indicate changes in lithium-ion chemistry will also reduce costs as the technology evolves. A third key factor is ongoing innovation with significant corporate and public research on batteries. Finally, the growth in the market (effective learning-by-doing), greater energy densities, and an increased diversity of chemistries will expand and change the dynamics of the supply chain for batteries, resulting in cheaper inputs to the battery pack (Mann et al., 2022).
The three scenarios for technology innovation are as follows:
- Conservative Technology Innovation Scenario (Conservative Scenario): The conservative projection comprises the maximum projection in 2026, 2035, and 2050 from the cost projections in the literature review (Cole et al., 2025).
- Moderate Technology Innovation Scenario (Moderate Scenario): The moderate projection is taken as the median point in 2026, 2035, and 2050 from the projections reviewed.
- Advanced Technology Innovation Scenario (Advanced Scenario): The advanced projections are taken as the lowest cost point in 2026, 2035, and 2050 from the projections reviewed.
Scenario Assumptions
Scenario assumptions were derived using a literature review and are not based on learning curves or deployment projections.
For a 60-MW 4-hour battery, the technology innovation scenarios for utility-scale BESS described above result in overnight capital cost reductions of 22% (Conservative Scenario), 45% (Moderate Scenario), and 66% (Advanced Scenario) between 2023 and 2035, with the largest cost reduction occurring from 2023 to 2024. The benchmark costs that are the focus of (Cole et al., 2025) focus on the costs for 2024, with 2023 costs retained from the 2024 ATB.
Between 2035 and 2050, the capital expenditure (CAPEX) reductions are 5% for the Conservative Scenario, 26% for the Moderate Scenario, and 27% for the Advanced cenario.
Methodology
Projected Utility-Scale BESS Costs: Future cost projections for utility-scale BESS are based on a synthesis of cost projections for 4-hour-duration systems as described by (Cole et al., 2025). The share of energy and power costs for batteries is based on the bottom-up cost model used in that work.
Capital Expenditures (CAPEX)
Definition: The bottom-up cost model used by (Cole et al., 2025) contains detailed cost components for battery-only systems costs. The costs for a 4-hour utility-scale stand-alone battery are detailed in Figure 1.
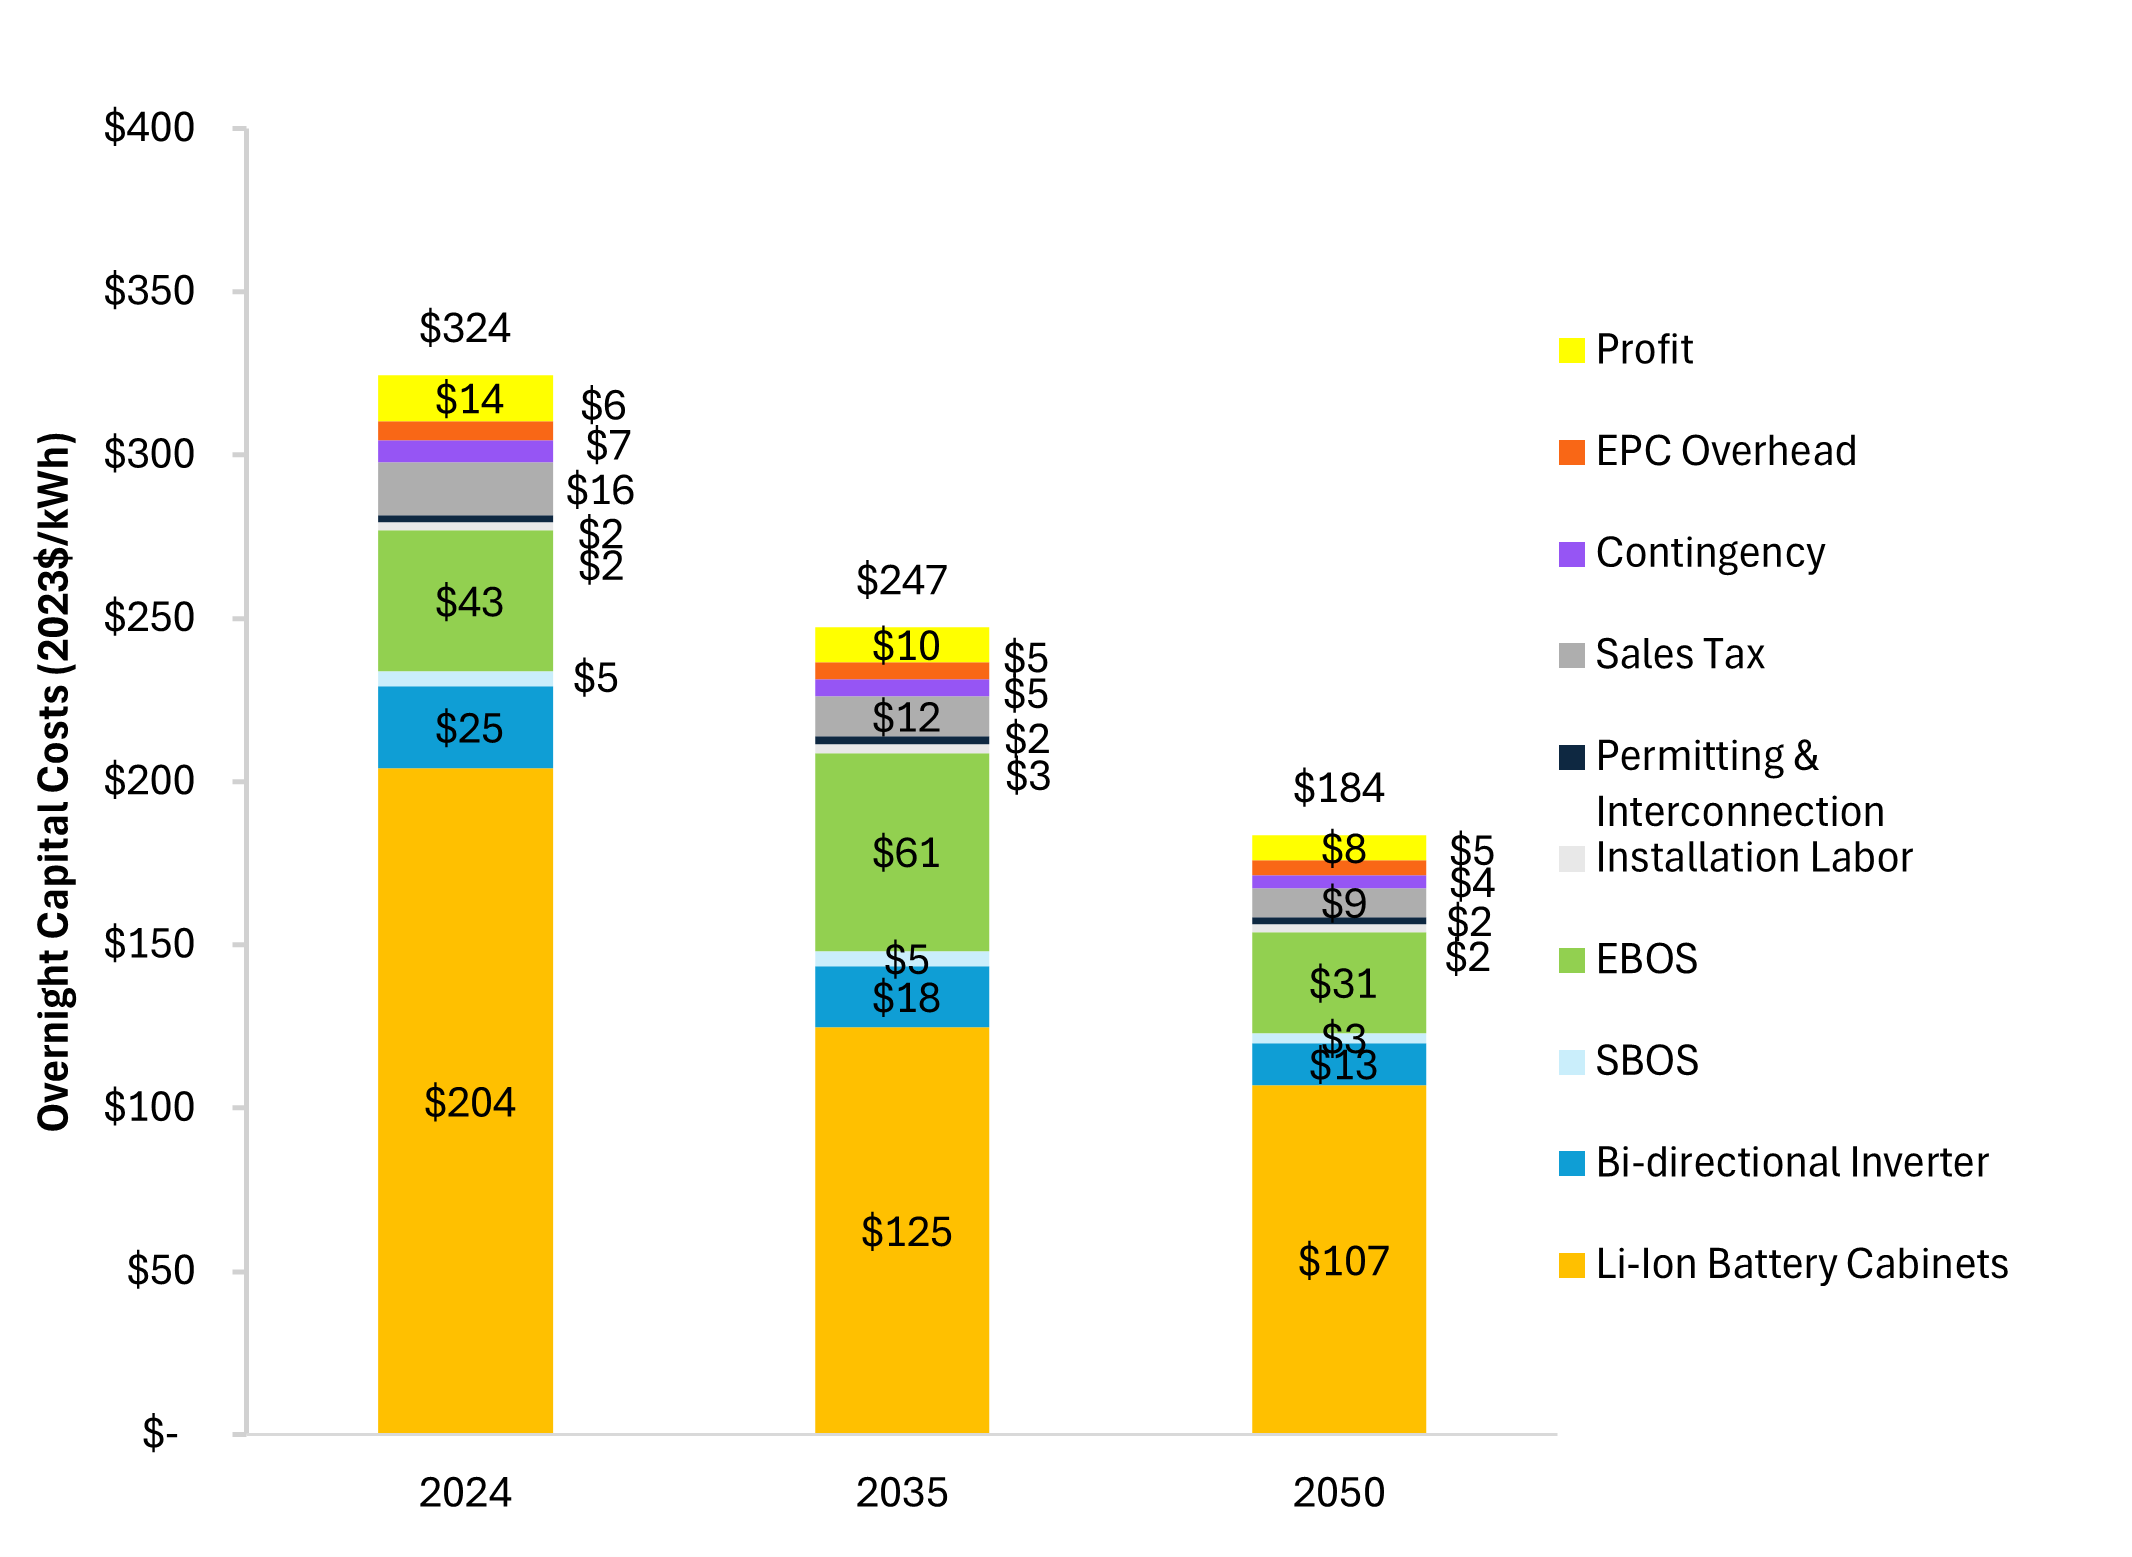
Current Year (2023): The 2023 cost for the 2025 ATB is assumed to be 30% higher than the 2024 cost based on estimates of cost changes from 2023 to 2024. The bottom-up cost modeling presented by (Cole et al., 2025) performs bottom-up cost modeling starting with 2024 systems.
Within the ATB Data spreadsheet, costs are separated into energy and power cost estimates, which allows capital costs to be calculated for durations other than 4 hours according to the following equation:
$$ \text{Total System Cost (\$/kW)} = \text{Battery Pack Cost (\$/kWh)} \times \text{Storage Duration (hr)} + \text{BOS Cost (\$/kW)} $$
For more information on the power versus energy cost breakdown, see (Cole et al., 2025).
Future Projections: Future cost projections for utility-scale BESS are based on a synthesis of cost projections for 4-hour duration systems as described by Cole et al. (Cole et al., 2025), which used the median of published cost estimates to develop a Moderate Technology Cost Scenario and the maximum and minimum values to develop the Conservative and Advanced Technology Cost Scenarios, respectively. Within these projections, the energy portions of the capital cost decline more rapidly than the battery portions of the capital costs. This results in greater cost declines for longer-duration batteries (e.g., 10 hours) relative to shorter-duration batteries (e.g., 2 hours) into the future.
Operation and Maintenance (O&M) Costs
Base Year: (Cole et al., 2025) assume no variable O&M (VOM) costs. All operating costs are instead represented using fixed O&M (FOM) costs. The FOM costs include battery augmentation costs, which enables the system to operate at its rated capacity throughout its 15-year lifetime. FOM costs are estimated at 4% of the capital costs in $/kW. Items included in O&M are shown in the table below.
Future Years: In the 2025 ATB, the FOM costs and the VOM costs remain constant at the values listed above for all scenarios.
Capacity Factor
The cost and performance of the battery systems are based on an assumption of approximately one cycle per day. Therefore, a 4-hour device has an expected capacity factor of 16.7% (4/24 = 0.167), and a 2-hour device has an expected capacity factor of 8.3% (2/24 = 0.083). Degradation is a function of the usage rate of the model, and systems might need to be replaced at some point during the analysis period. We use the capacity factor for a 4-hour device as the default value for the ATB because 4-hour durations are anticipated to be more typical in the utility-scale market.
Roundtrip Efficiency
Roundtrip efficiency is the ratio of useful energy output to useful energy input. Based on Cole et al. (Cole et al., 2025), the 2025 ATB assumes a roundtrip efficiency of 85%.
References
The following references are specific to this page; for all references in this ATB, see References.