Geothermal
2025 Electricity Annual Technology Baseline (ATB) data for geothermal are shown above. The Base Year hydrothermal costs are derived from actual geothermal power plant data. Near-term (2023 - 2034) enhanced geothermal system (EGS) costs are a combination of actual costs from recent commercial-scale drilling and completions projects and predictions based on reported improvements in a package of technologies being field demonstrated at both pilot and commercial scales. The future (2035 - 2060) cost projections primarily use bottom-up models derived from the analysis and results of the GeoVision: Harnessing the Heat Beneath our Feet report with significant technology and cost assumption updates reflected in the 2023 Enhanced Geothermal Shot Analysis (DOE, 2019); (Augustine et al., 2023). The GeoVision analysis was a collaborative multiyear effort with contributors from industry, academia, national laboratories, and federal agencies. The GeoVision and Enhanced Geothermal Shot Analysis reports updated resource potential estimates as well as projected capital expenditures (CAPEX) and operations and maintenance (O&M) costs through evaluation of recent industry trends. Successive ATB analyses have also updated these resource potential and cost estimates. These reports and analyses have estimated the impact of advancements in technology areas such as drilling efficiency, well construction materials, EGS stimulation success, and production rates that are rapidly reducing the costs and risks of next-generation geothermal commercialization. Drilling and EGS technology improvements enable reduced project development timelines, CAPEX, and financing rates (DOE, 2019); (Augustine et al., 2023); (Schulz and Livescu, 2023); (El-Sadi et al., 2024); (Dupriest and Noynaert, 2024); (DOE, 2024); (Norbeck et al., 2024).
The Base Year values of levelized cost of energy (LCOE) for hydrothermal plants fall within the bounds of other publications and recent geothermal power purchase agreements (PPAs) shown in the table below (IRENA, 2024); (Lazard, 2024); (DOE, 2024). On the EGS front, there has been significant technical progress, as documented in the 2025 U.S. Geothermal Market Report (Akindipe et al., 2026) and continues to be made through the Frontier Observatory for Research in Geothermal Energy (FORGE) initiative, funded by the U.S. Department of Energy (DOE), and other ongoing industry-led pilot demonstrations and commercial projects. With the addition of new EGS research and demonstration (e.g., the EGS Pilot Demonstration) activities under the Bipartisan Infrastructure Law Enhanced Geothermal Systems (EGS) Pilot Demonstrations funding opportunity as well as the Enhanced Geothermal Shot initiative launched in 2023, EGS technical progress toward economical operations is accelerating. Technical progress in drilling and reservoir stimulation is already being reported with exponential intra- and interproject learnings (Norbeck et al., 2023); (El-Sadi et al., 2024); (Dupriest and Noynaert, 2024). There has also been an uptick in private sector investment in EGS development. Between 2021 and 2025, more than $1.5 billion has been invested in companies leading the development and commercial deployment of EGS (Akindipe et al., 2026). These efforts have led to multiple signings of PPAs between EGS developers and clean energy offtakers for electricity from EGS-based power plants with a flagship 100-megawatts-electric (MWe) power plant scheduled to begin power generation by 2026 (DOE, 2024). The rise in commercial readiness and large-scale demand growth from the data centers (Richter, 2025), alongside reported progress in EGS field demonstrations and commercial project developments, has informed significant updates to the baseline performance assumptions and plant capacities in the 2025 ATB. An agreement list containing contractual pricing terms for some public geothermal PPAs signed from November 2019 through June 2025 can be found in the table below (Akindipe et al., 2026); (DOE, 2024).
| Project* | State | Size (megawatts [MW]) | Pricing ($/megawatt-hour [MWh]) | Term (years) |
|---|---|---|---|---|
| Hell’s Kitchen | California | 40 | 75 | 25 |
| Whitegrass | Nevada | 3 | 67.50 | 25 |
| Star Peak | Nevada | 12.5 | 70.25 | 25 |
| Casa Diablo | California | 16 | 68 | 20 |
| Puna | Hawaii | 46 | 70 | 30 |
| Makushin | Alaska | 30 | 69 | 30 |
| Geysers - Sacramento | California | 100 | 99 | 10 |
| Geysers - Oakland | California | 2 | 70 | 12 |
* Only PPAs with pricing information are included. Other signed PPAs with undisclosed pricing information can be found in (Akindipe et al., 2026); (DOE, 2024).
The three scenarios for technology innovation are as follows:
- Conservative Technology Innovation Scenario (Conservative Scenario): Continuation of current industry trends in drilling represented by the 2025 Geothermal Drilling Cost Curves (e.g., minor efficiency improvements from the 2025 baseline costs with little to no increase in rate of penetration [ROP]) and EGS reservoir creation and performance (e.g., limited increase in flow rate and stimulation success rate) result in minor CAPEX improvements by 2035. In addition, the recent Categorical Exclusion designation for resource confirmation activities is fully in effect, leading to significantly shorter permitting timelines across all innovation scenarios (BLM, 2025).
- Moderate Technology Innovation Scenario (Moderate Scenario): Drilling advancements (e.g., doubled ROP and bit life from GeoVision baseline and reduced number of casing intervals and associated drilling materials) detailed as part of the GeoVision report (DOE, 2019) and EGS stimulation successes from DOE-funded EGS Collab and FORGE projects (Kneafsey et al., 2022); (Dupriest and Noynaert, 2024) and industry commercial projects (Norbeck et al., 2023); (El-Sadi et al., 2024); (So et al., 2024) result in cost improvements that are fully achieved industrywide by 2035. In addition, as part of 2025 ATB updates, this scenario assumes binary power plants are built to a capacity of 50 megawatts (MW) because of the proliferation of higher-capacity and low-maintenance turbines (Ormat Technologies, 2024); (Cariaga, 2024).
- Advanced Technology Innovation Scenario (Advanced Scenario): Substantial drilling and EGS advancements (e.g., significantly increased ROP, bit life, and EGS stimulation success; limited casing intervals; significantly reduced consumption of drilling materials; and reduced development timelines) as modeled in the Technology Improvement scenario of the GeoVision report result in cost improvements achieved by 2035. Advanced Scenario EGS power plants are assumed to be built with 100 MW of capacity to maximize project efficiency. Permitting timelines reflect anticipated permit streamlining effects of a National Geothermal Energy Coordination Office, as enacted through the Energy Act of 2020.
Geothermal technologies are not among the limited set of technologies explored in the pilot Expanded Cost Drivers Case, and therefore 2025 ATB technology innovation scenarios do not capture supply chain constraints or other cost factor assumptions for these technologies.
Resource Categorization
Within the 2025 ATB, geothermal resources broadly comprise two main types: hydrothermal and EGS. Although nascent technologies such as closed-loop geothermal (or advanced geothermal) and superhot rock systems fall within the category of geothermal for electricity generation, they are not covered in the 2025 ATB. Hydrothermal systems are naturally occurring zones of earth-heated circulating fluid that can be exploited for electricity generation if certain minimum temperatures and flow rates are achieved for a given power plant technology. Hot rocks suitable for EGS exhibit naturally occurring zones of heat but lack sufficient fluid flow and require substantial stimulation to enhance permeability. These two resource types are subdivided based on site-specific resource characteristics and compatible power plant technology into two types of energy conversion processes used to generate geothermal electricity:
- Binary plants use a heat exchanger and secondary working fluid with a boiling point below that of water to transfer geothermal energy through an organic Rankine cycle. Although commercial cycles can operate up to a maximum temperature of 300°C, in the geothermal representation within the Electricity ATB, they generally apply to lower-temperature systems (<200°C) because of the current maximum operating temperature of pumping technology. Generally, binary plants have higher CAPEX than flash plants because of the increased number of components and their lower-temperature operation, which translates to a requirement of more wells to be drilled for a given power output. Ongoing work to capture off-design performance of binary power cycles will be reflected in future geothermal supply curves.
- Flash plants generate steam through a pressure change of the thermal fluid that directly drives a turbine. This technology generally applies to higher-temperature systems. Because of the reduced number of components and higher-temperature operation, these systems generally produce more power per well, requiring fewer wells and reducing drilling costs. Therefore, flash-based systems generally have lower CAPEX than binary systems. For the ATB, a double (or dual) flash cycle is assumed because of its higher cost-optimized efficiency compared to single- or triple-flash cycles. In addition, double-flash plants are the most used among other flash plants in the U.S. geothermal industry (Robins et al., 2021).
Hybrid plants, or a combination of binary and flash systems, are used in some locations but are not modeled in the ATB.
The ATB defines flash-plant resources as those with temperatures at or above 200°C and binary-plant resources as those with temperatures from 110 to <200°C. This delineation is not based on physical constraints on today's technologies but was initially predicated on pumping technology temperature limits for binary plants as defined in the Geothermal Electricity Technology Evaluation Model (GETEM) (Mines, 2016). EGS resources are further subdivided into near-hydrothermal field EGS (NF-EGS) and deep EGS. NF-EGS are those developed on the periphery of identified, producing hydrothermal sites, also known as brownfield sites, while deep EGS refers to development in less-characterized regions between 3-7 km deep. The resulting geothermal resource supply curves comprise six categories: hydrothermal flash, hydrothermal binary, NF-EGS flash, NF-EGS binary, deep-EGS flash, and deep-EGS binary. For illustration in the ATB, six representative geothermal plants are shown with design parameters based on each resource category. Based on the technology definitions for the 2025 ATB, the hydrothermal technologies are considered mature technologies. The EGS technologies are now updated from nascent to mature because the first commercial EGS plant—Fervo's Project Cape Station in Utah—was under construction in the Base Year (i.e., 2023). Although EGS technologies have attained technology maturity, they are not at the same level of market scalability as hydrothermal technologies.
Examples using these plant types in each of the three resource categories (hydrothermal, NF-EGS, and deep EGS) are shown in the ATB visualization.
| Technology | Temperature (°C) | >=200 | 150–200 | 135–150 | <135 |
|---|---|---|---|---|---|
| Hydrothermal | Number of identified sites | 20 | 21 | 17 | 57 |
| Total identified capacity (MW) | 3,824 | 783 | 378 | 581 | |
| Average overnight capital cost, or OCC ($/kilowatt [kW]) | 4,362 | 9,302 | 10,145 | 18,832 | |
| Minimum OCC ($/kW) | 3,118 | 4,928 | 8,261 | 12,566 | |
| Maximum OCC ($/kW) | 6,158 | 36,267 | 11,949 | 25,769 | |
| Example of plant OCC ($/kW)* | 4,735 | 6,299 | N/A | ||
| Number of undiscovered sites | 7 | 8 | 2 | 17 | |
| Total undiscovered capacity (MW) | 14,909 | 3,810 | 869 | 6,223 | |
| Average OCC ($/kW) | 3,655 | 7,416 | 9,866 | 19,158 | |
| Minimum OCC ($/kW) | 3,316 | 6,742 | 9,866 | 15,177 | |
| Maximum OCC ($/kW) | 4,298 | 8,254 | 9,866 | 24,043 | |
| NF-EGS | Number of sites | 28 | 30 | 19 | 76 |
| Total capacity (MW) | 15,880 | 3,028 | 820 | 4,759 | |
| Average OCC ($/kW) | 5,405 | 12,150 | 13,632 | 27,510 | |
| Minimum OCC ($/kW) | 4,001 | 6,093 | 10,642 | 17,462 | |
| Maximum OCC ($/kW) | 8,176 | 60,166 | 16,182 | 40,003 | |
| Example of plant OCC ($/kW) | 6,167 | 8,184 | N/A | ||
| Deep EGS (3–7 kilometers [km]) | Number of sites | N/A | N/A | N/A | |
| Total capacity (MW) | 7,000,000+ | ||||
| Average OCC ($/kW) | 9,868 | 16,795 | |||
| Minimum OCC ($/kW) | 7,416 | 10,042 | |||
| Maximum OCC ($/kW) | 14,500 | 26,194 | |||
| Example of plant OCC ($/kW) | 6,653 | 10,758 | |||
* Same for both identified and undiscovered hydrothermal resources.
The hydrothermal resource potential is concentrated in the western United States. The total mean potential estimated by the U.S. Geological Survey (USGS) in 2008 was 39,090 MW: 9,057 MW identified and 30,033 MW undiscovered (USGS, 2008). Using the USGS estimates, the potential hydrothermal capacity is 31,376 MW, comprising 5,566 MW of identified and 25,810 MW of undiscovered resources. The reduction in undiscovered resources is because of nontechnical barriers defined in the GeoVision report such as legal prohibitions to geothermal development in federally protected areas, including national parks and monuments. The potential capacity for the identified resources is based on available reservoir thermal energy information from studies conducted at the sites (USGS, 2008); (Williams et al., 2009), subsequent research on plant additions and retirements conducted for the 2021 market report (Robins et al., 2021), and input from plant operators. Therefore, the identified resource capacity is the capacity available for future deployment and not the mean capacity estimated in the initial 2008 USGS assessment. The current undiscovered hydrothermal resource estimate is based on a series of geographic information system statistical models of the spatial correlation of geological factors that facilitate the formation of geothermal systems (Williams et al., 2009), excluding sites in federally protected lands. The National Laboratory of the Rockies (NLR) has recently estimated resource capacity potential for hydrothermal on publicly accessible lands as >130,000 MW using the Renewable Energy Potential (reV) model (Mai et al., 2025). In future ATB cycles, the reV-based resource potential methodology will be used to assess available geothermal capacity and to develop geothermal supply curves.
For the 2025 ATB total capacity estimations, the original USGS resource potential estimates for hydrothermal are updated with the following modifications:
- Installed capacity of about 3.7 gigawatts (GW) is excluded from the resource potential used in the 2019 GeoVision study (DOE, 2019); (Robins et al., 2021).
- 296 MW of net capacity has been brought online since 2021 based on data gathered for the 2025 U.S. Geothermal Market Report and is not included in the 2025 ATB resource potential (Akindipe et al., 2026).
- Resources on federally protected and U.S. Department of Defense lands, where development is highly restricted, are excluded from the resource potential, as are resources on lands where significant barriers that prevent or inhibit the development of geothermal projects were identified by Augustine, Ho, and Blair (Augustine et al., 2019).
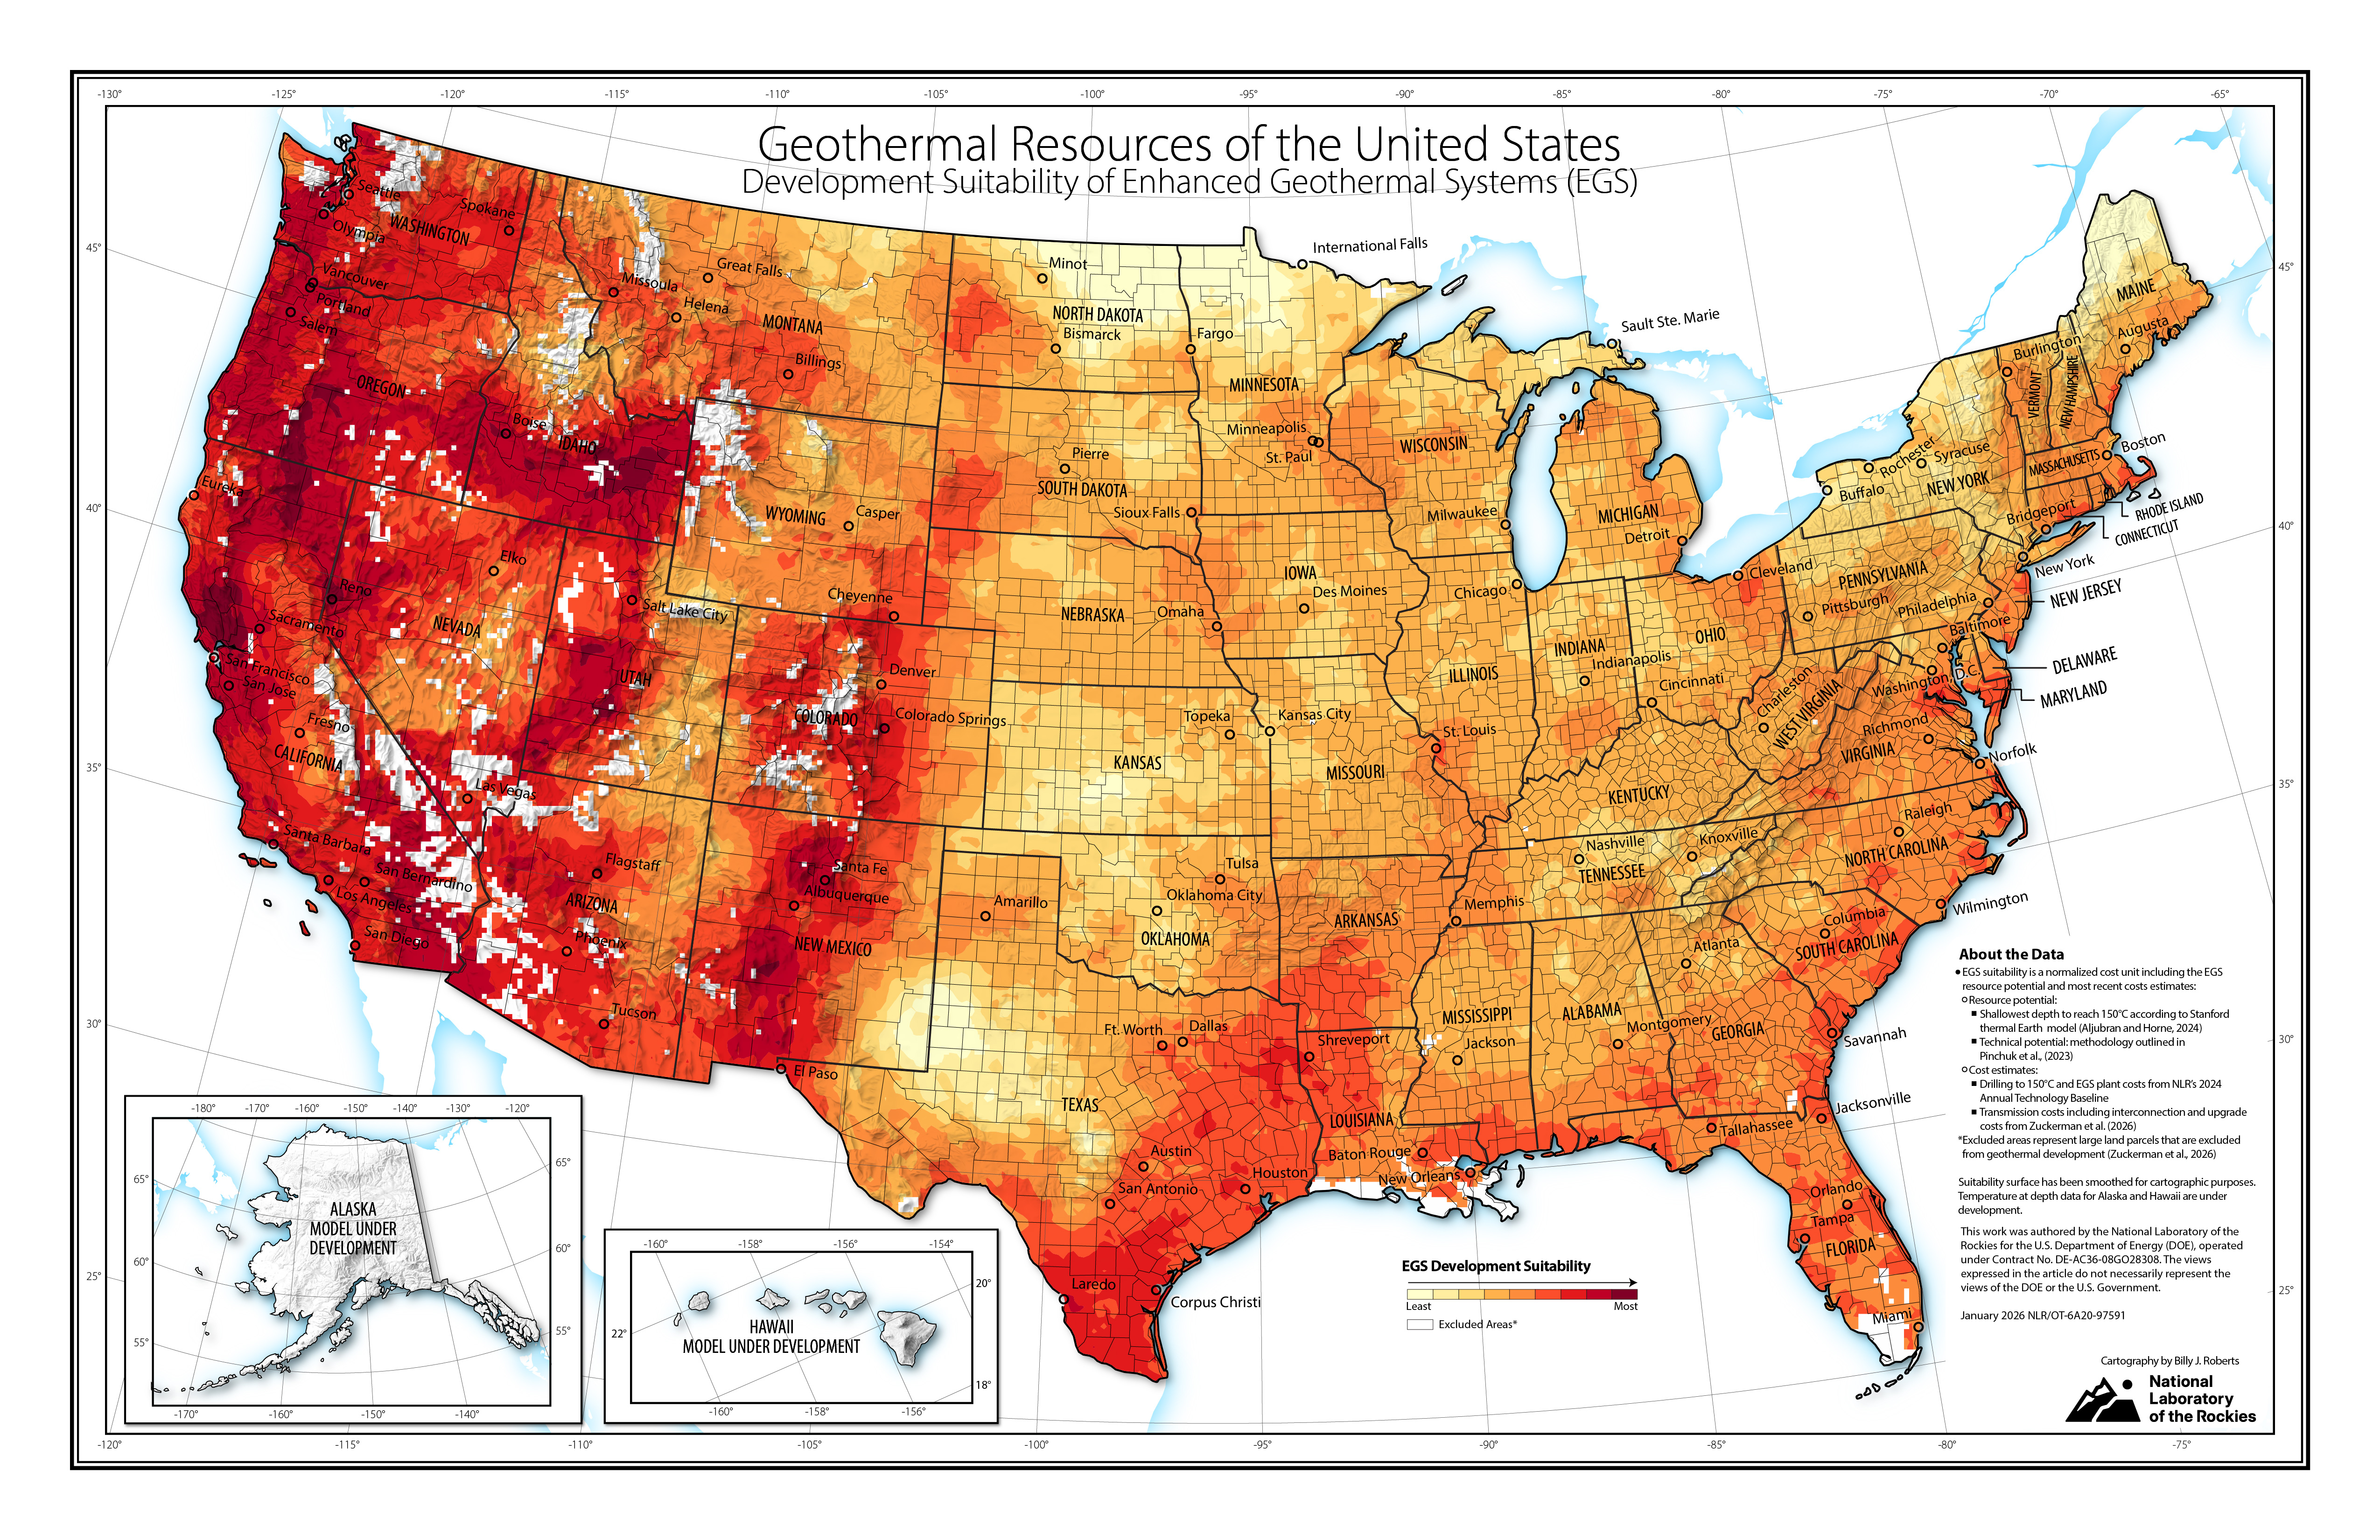
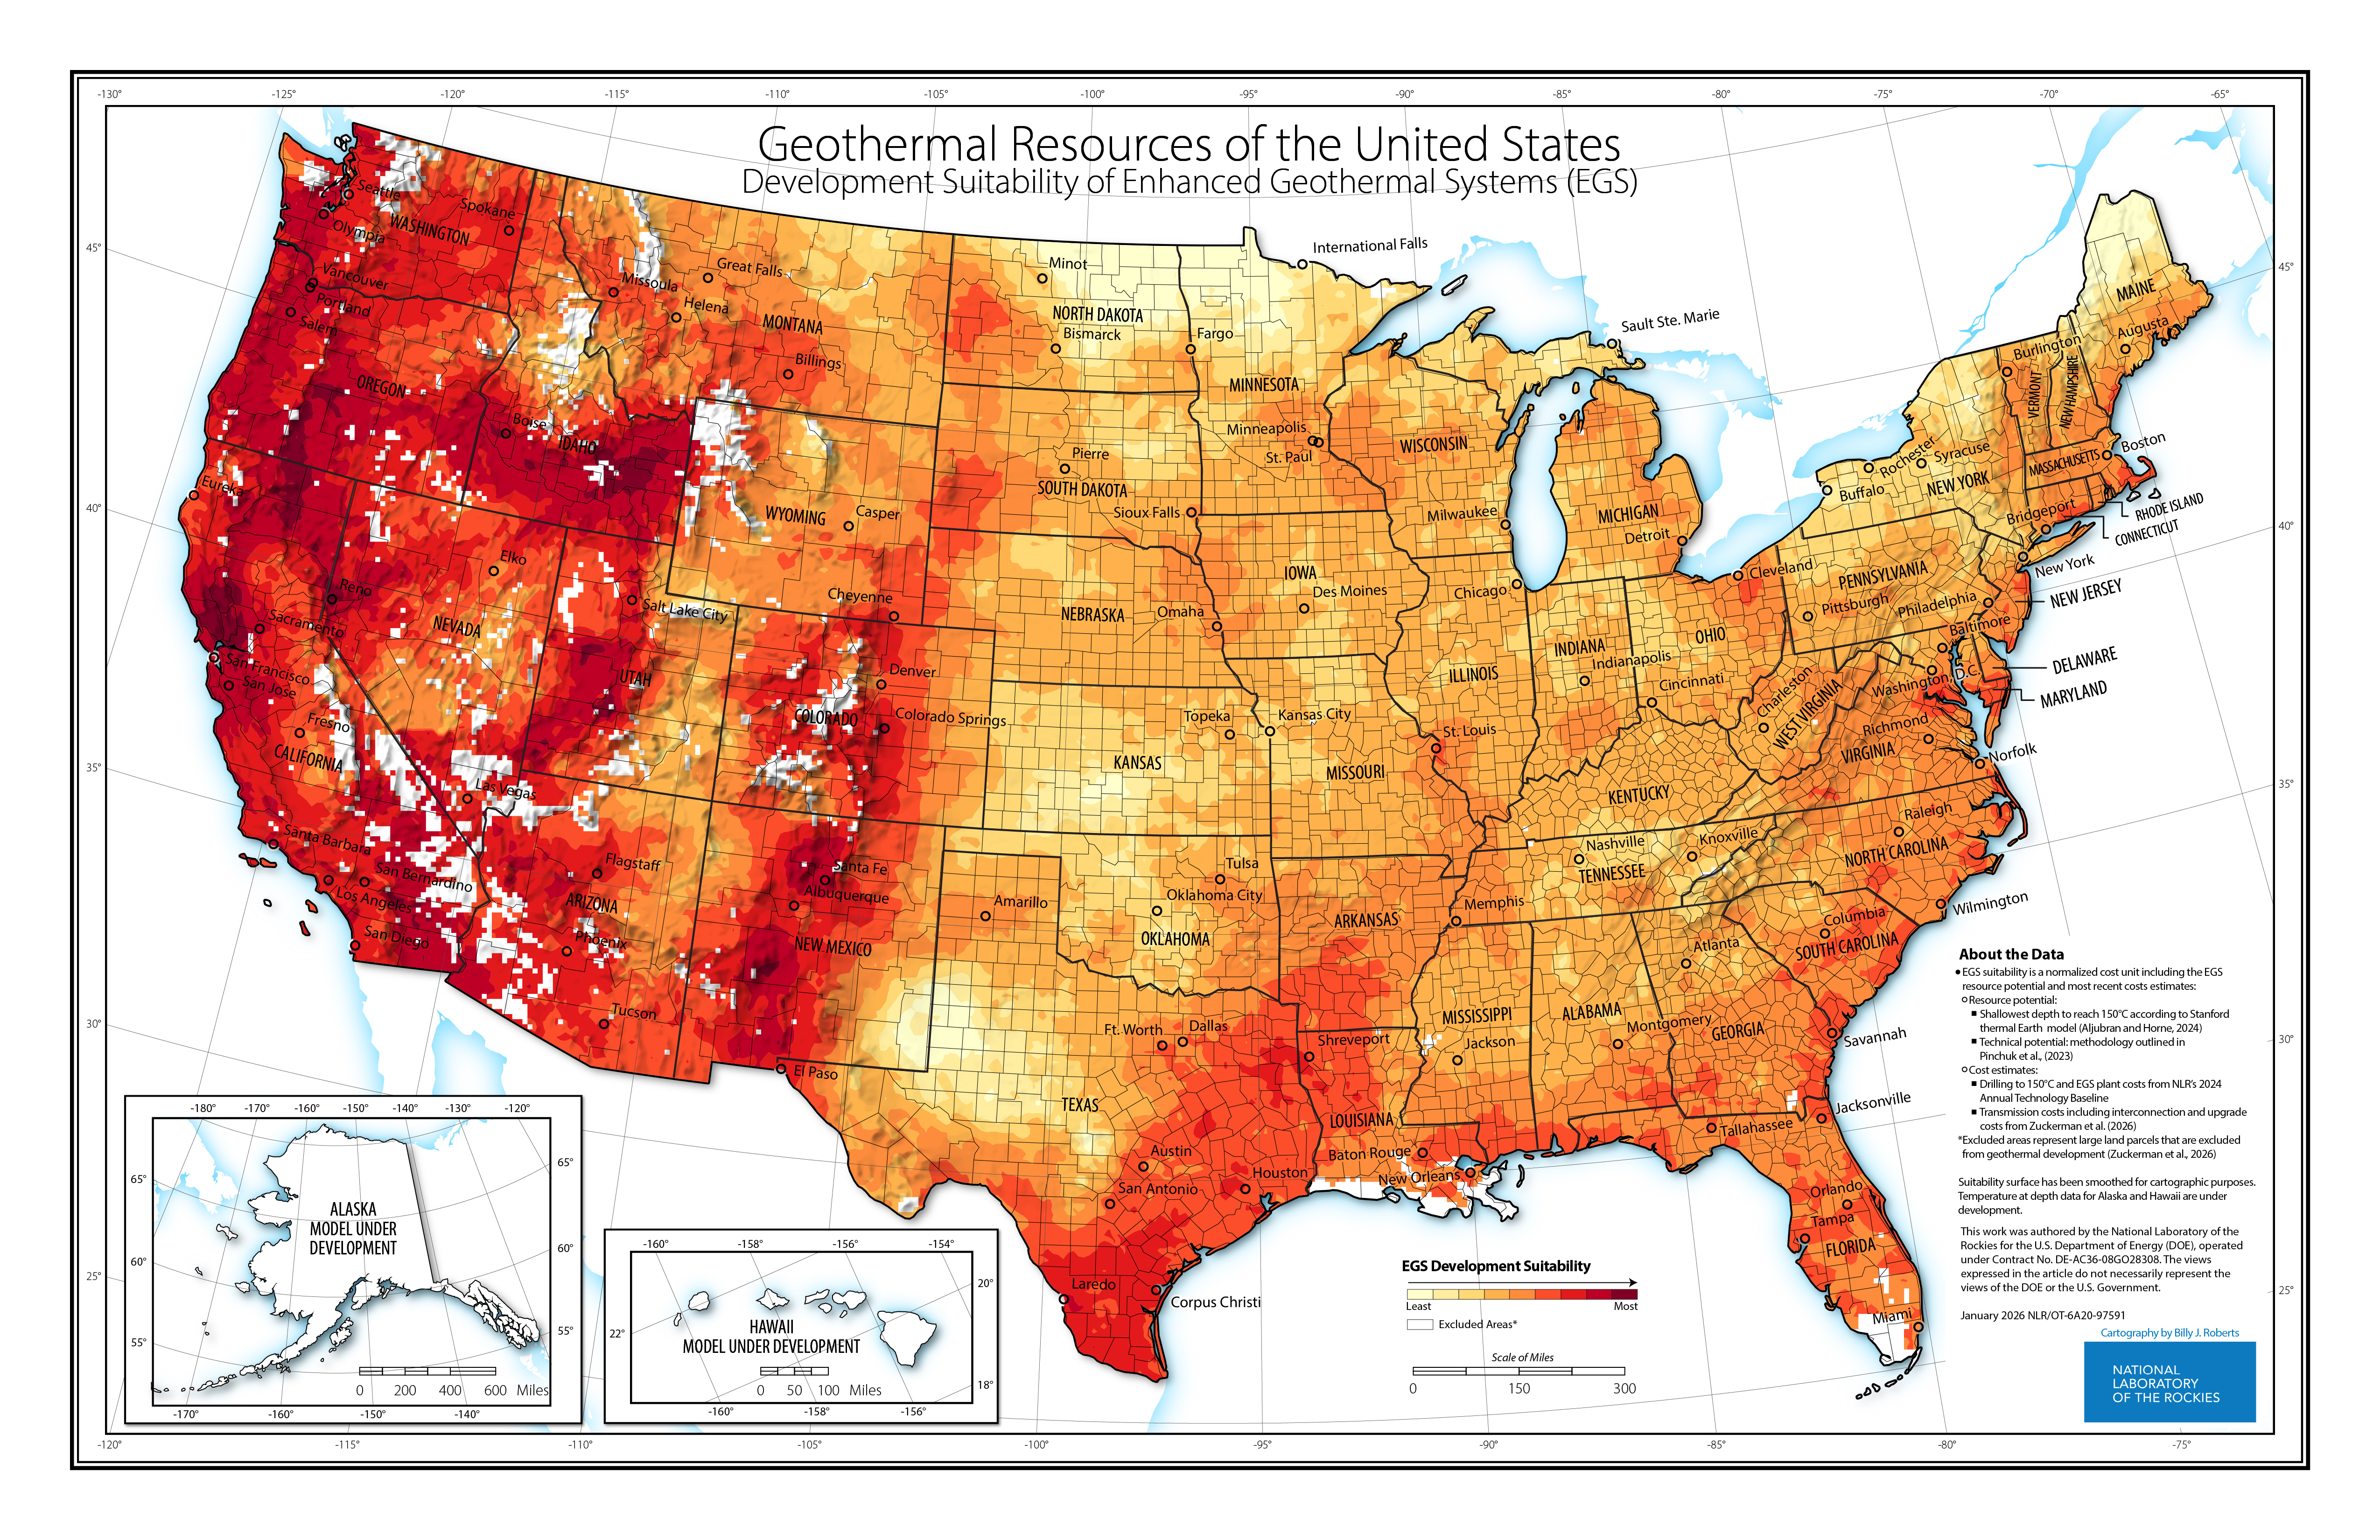
The EGS resource potential is concentrated in the western United States, but technology innovations as described in the Advanced Scenario and in the 2023 Enhanced Geothermal Shot initiative are anticipated to increase potential beyond the western United States (Augustine et al., 2023). Recent studies that have evaluated EGS resource potential in the United States have developed various estimations. For the Enhanced Geothermal Shot analysis, a total (NF-EGS plus Deep-EGS) resource potential of 7,497,168 MW (i.e., 7,497 GW) was estimated (Augustine et al., 2023). A study by researchers from Stanford University that developed and used an updated machine-learning-generated temperature at depth model, the Stanford Temperature Model (STM), resulted in a resource estimate of 35,808 GW within 1–7 kilometers (km) of subsurface depths (Aljubran and Horne, 2024). The most recent NLR study that developed resource potential estimates from STM-based temperature at depth data with the reV model estimates 22,438 GW of EGS potential (Menon et al., 2025). These two studies do not differentiate NF-EGS from Deep-EGS resources. For the 2025 ATB, we have used the same assumption as the Enhanced Geothermal Shot analysis to differentiate NF-EGS from Deep-EGS resources. The 24,487-MW NF-EGS resource estimate is based on the premise that NF-EGS sites will be within the periphery of both identified and undiscovered hydrothermal sites (Augustine et al., 2023). The Deep-EGS favorability map above and many other geothermal resource maps can be created using data from NLR's Geothermal Energy Atlas (formerly the Geothermal Prospector tool).(U.S. Department of the Interior, 2025)
Scenario Descriptions
| Scenario | Drilling Advancements | EGS Development |
|---|---|---|
| Conservative Scenario | Technology Description: Drilling efficiency improvements (e.g., using mechanical specific energy with polycrystalline diamond compact bits and limiting bit dysfunction leads to longer bit life) result in minor decreases in drilling costs beyond the 2025 baseline costs (Akindipe and Witter, 2025) and little to no timeline reduction. Justification: Substantial increases in drilling ROP are unlikely without wider adoption of oil and gas technologies and new bit innovations. | Technology Description: Current well stimulation techniques do not consistently generate adequate economic flow rates of sustained flow from unsuccessful wells, which leads to little to no improvement of drilling success rate or CAPEX reduction. Justification: Stimulation is cost-prohibitive and lacks zonal isolation. Both the precision and scale of stimulation must improve. |
| Moderate Scenario | Technology Description: ROP and bit life are doubled from the GeoVision Baseline. Timelines and consumption of drilling materials are reduced. Justification: Cost modeling of drilling improvements along with successful field demonstrations and commercial pilots and abundant oil and gas experience confirm this level of advancement is achievable. | Technology Description: As in the Conservative Scenario, although stimulation success has progressively improved, stimulation techniques remain cost-prohibitive. Justification: To remain consistent with the GeoVision report (DOE, 2019), cost modeling for stimulation technology has yet to be performed for a Mid Case scenario. In addition, successful deployment of EGS technology is modeled as coupled with significant drilling advancements because lower drilling costs and improved directional drilling in hard rock environments will likely help enable EGS reservoir development. |
| Advanced Scenario | Technology Description: ROP and bit life are increased fourfold over the Conservative Scenario. Wells are constructed as monobore wells using expandable casing. The increased speeds result in significantly shorter timelines and lower consumption of drilling-related materials. Justification: Ongoing Advanced Research Projects Agency–Energy, Sandia National Laboratories, NLR, and other research (e.g., laser drilling, millimeter wave, and electric pulse) is directed at reducing the cost and duration of well drilling. Growing interest from the oil and gas sector is leading to knowledge transfer. Monobore wells are already being drilled in that sector. | Technology Description: Stimulation success rate, control, and sustained flow rate advance to economic levels. EGS power plants are built with 100 MW of capacity. Permitting timelines are reduced to reflect anticipated permit streamlining effects of a National Geothermal Energy Coordination Office, as created in the Energy Act of 2020. Justification: FORGE initiative, GLADE Project, and other DOE Office of Geothermal-sponsored research are demonstrating stimulation techniques in hard rock environments, including hydraulic shearing and zonal isolation. Commercial success of Fervo projects. In addition, EGS developments are not resource-constrained, so larger plants will be more economical to build and operate. |
| Impacts |
|
|
| References |
|
Scenario Assumptions
For the 2025 ATB, several assumptions are updated for the Conservative, Moderate, and Advanced Scenarios based on consultations with geothermal industry experts and stakeholders and an updated literature search (IFC, 2013); (Snyder et al., 2017); (Norbeck et al., 2023); (Norbeck and Latimer, 2023); (El-Sadi et al., 2024). The drilling costs for the Conservative Scenario for all technologies decrease from previous levels to those of the updated baseline drilling cost curves (Akindipe and Witter, 2025). The new baseline cost curves developed by NLR consider the significant progress in drilling performance and efficiency that have been recorded at the Utah FORGE site, the Cape Station project in Utah (El-Sadi et al., 2024), and a recent drilling demonstration at The Geysers (So et al., 2024). The Moderate and Advanced Scenario drilling cost assumptions are not changed from their 2024 ATB values. The plant contingency factor for all technologies and scenarios remains at the 10% level set in the 2023 ATB to ensure consistency with other thermal energy systems (Theis, 2021). This plant-level factor does not include the contingency for drilling and completions that is already accounted for in the Well Cost Simplified model (Lowry et al., 2017a).
Several assumptions have been updated in the GETEM model, including the following:
- Successful full-size exploration wells: Decreased from five to three wells for the NF-EGS and Deep-EGS Conservative Scenarios based on current industry trends and consultations with project developers (Norbeck et al., 2024).
- Exploration drilling success rate: Revised from 52% to 60% for the Hydrothermal Conservative, Hydrothermal Moderate, and Deep-EGS Conservative Scenarios. Updated from 75% to 80% for the Conservative NF-EGS Scenario. The Hydrothermal cases are updated to conform with global average exploration drilling success rates that were already at 59% in 2013 (IFC, 2013). Updates to the NF- and Deep EGS success rates are based on deviated and horizontal well drilling successes in EGS projects in Nevada and Utah (Norbeck et al., 2023); (El-Sadi et al., 2024); (Norbeck et al., 2024) and consultations with industry stakeholders.
- Development drilling success rate: Up from 76% to 80% for the Hydrothermal Moderate Scenario. This increase is implemented with the assumption that development drilling success rate will attain global average operational well success rates (IFC, 2013). The NF-EGS and Deep-EGS Conservative drilling success rate is increased from 80% to 82% and 76% to 80%, respectively. For both NF-EGS and Deep-EGS Moderate Scenarios, the success rate is up from 80% to 85%. These increments are based on successful field development drilling at Cape Station in Utah (El-Sadi et al., 2024); (Norbeck et al., 2024).
- Stimulation success rate: Updated from 80% to 82% for the NF-EGS Moderate Scenario, respectively, in accordance with industry trends in hydraulic fracturing and results from circulation tests at FORGE and Cape Station (Xing et al., 2024); (Norbeck et al., 2024); (Xing et al., 2025).
- Well size: Updated the well size for the EGS Conservative Scenarios from large-diameter (12.25-in. hole and 9.625-in. casing size) to small-diameter (8.5-in. hole and 7-in. casing), saving on drilling costs. This revision is based on observations from completed and ongoing EGS projects in Nevada and Utah (Akindipe and Witter, 2025).
- Flow rate per production well: Updated from 80 kilograms per second (kg/s) in the 2024 ATB to 90 kg/s for the EGS Moderate Scenarios with the expectation that the steady-state flow rates recorded during the Cape Station 30-day circulation test become attainable industrywide by 2035 (Norbeck et al., 2024). The EGS Advanced flow rates were also increased from 110 kg/s to 120 kg/s based on the maximum flow rate attained during the Cape Station circulation test (Norbeck et al., 2024).
- Productivity/injectivity index: Productivity and injectivity indexes remain the same as in the 2024 ATB for all scenarios.
- Plant size: Plant size is increased to 50 MW for binary plants in all Moderate Scenarios and in the Hydrothermal Advanced Scenario. This update is based on the novel plain bearing turbine technology that is designed to provide higher shaft power than previous turbine designs (Ormat Technologies, 2024). The plant size for the Hydrothermal Flash Advanced scenario was also increased from 40 MW to 50 MW to represent the 75th percentile size of operating flash plants compiled by (Robins et al., 2021).
- Permitting timeline: Revised from the GeoVision assumptions in anticipation of the effect of the recent rule from the Bureau of Land Management (BLM) that removes the requirement of an Environmental Assessment via a Categorical Exclusion for geothermal resource confirmation activities (BLM, 2025). Additional Categorical Exclusions recently released focus on streamlining approvals and permitting for subsurface exploration activities, and are similarly expected to shorten geothermal permitting timelines (U.S. Department of the Interior, 2025); (U.S. Department of the Interior, 2026).
- Construction duration: The EGS Conservative Scenario construction timeline is reduced from 10 to 8 years as a result of the accelerated field development at Cape Station, which is expected to deliver its first 100 MW by 2026.
| GETEM Input Parameter | Hydrothermal | |||
| Conservative | Moderate | Advanced | ||
| Exploration | Successful full-size wells | 3 | 3 | 3 |
| Drilling and Completion | Drilling cost curve | 2025 Baseline | Intermediate I | Ideal |
| Success rate (exploration) | 60% | 60% | 75% | |
| Success rate (development) | 76% | 80% | 90% | |
| Reservoir Performance | Flow rate per production well | 110 kg/s (binary) 80 kg/s (flash) | 110 kg/s (binary) 80 kg/s (flash) | 110 kg/s (binary) 80 kg/s (flash) |
| Productivity index | 2,500 lb/hr-psi | 6,370 lb/hr-psi | 18,200 lb/hr-psi | |
| Injectivity index | 3,000 lb/hr-psi | 7,645 lb/hr-psi | 21,840 lb/hr-psi | |
| Plant Size | Power sales | 30 MW (binary) 40 MW (flash) | 50 MW (binary) 40 MW (flash) | 50 MW (binary) 50 MW (flash) |
| Permitting | Duration of permitting for exploration and early drilling activities | 0.75 year | 0.5 year | 0.25 year |
| GETEM Input Parameter | NF-EGS | Deep-EGS | |||||
| Conservative | Moderate | Advanced | Conservative | Moderate | Advanced | ||
| Exploration | Successful full-size wells | 3 | 3 | 2 | 3 | 3 | 2 |
| Drilling and Completion | Drilling cost curve | 2025 Baseline | Intermediate I | Ideal | 2025 Baseline | Intermediate I | Ideal |
| Success rate (exploration) | 80% | 80% | 95% | 60% | 60% | 95% | |
| Success rate (development) | 82% | 85% | 95% | 80% | 85% | 95% | |
| Success rate (stimulation) | 82% | 85% | 95% | 80% | 85% | 95% | |
| Reservoir Performance | Flow rate per production well | 60 kg/s | 90 kg/s (binary) 60 kg/s (flash) | 120 kg/s (binary) 80 kg/s (flash) | 60 kg/s | 90 kg/s (binary) 60 kg/s (flash) | 120 kg/s (binary) 80 kg/s (flash) |
| Productivity index | 1,365 lb/hr-psi | 2,500 lb/hr-psi | 6,370 lb/hr-psi | 1,365 lb/hr-psi | 2,500 lb/hr-psi | 6,370 lb/hr-psi | |
| Injectivity index | 1,650 lb/hr-psi | 3,000 lb/hr-psi | 7,645 lb/hr-psi | 1,650 lb/hr-psi | 3,000 lb/hr-psi | 7,645 lb/hr-psi | |
| Plant Size | Power sales | 30 MW (binary) 40 MW (flash) | 50 MW (binary) 40 MW (flash) | 100 MW | 30 MW (binary) 40 MW (flash) | 50 MW (binary) 40 MW (flash) | 100 MW |
| Permitting | Duration of permitting for exploration and early drilling activities | 0.75 year | 0.5 year | 0.25 year | 0.75 year | 0.5 year | 0.25 year |
Estimated bottom-up costs for the representative plants in the Moderate and Advanced Scenarios are the projected costs at the full deployment year (i.e., 2035). Between 2023 and 2035, learning rates are applied to account for annual learning-by-doing-based capacity deployments. In the 2023 ATB, separate learning rates for hydrothermal and EGS technologies were established through an NLR literature review. This literature review examined the application of one-factor, two-factor, and multifactor learning curves in geothermal, unconventional oil and gas drilling, and other renewable energy technologies. A single-factor learning curve, with a learning rate representing industrywide learning, is used in the ATB cost projections (Fukui et al., 2017). As in the 2023 and 2024 ATBs, a 13% learning rate is used to create the Moderate hydrothermal cost curve between 2023 and 2035 based on historical learning rates in the unconventional oil and gas industry (Fukui et al., 2017). EGS has a higher learning rate than hydrothermal systems because it can take advantage of significant cost reductions from ongoing technology improvements and economies of scale. An 18% learning rate is used in the Moderate EGS cost curves, reflecting the low-end approximation for learning rates found in (Latimer and Meier, 2017). The Advanced hydrothermal cases use the high-end estimation of learning rates of 30% found in (Latimer and Meier, 2017). This learning rate also falls within the range predicted in the report by (Schulz and Livescu, 2023) on the effect of the full extent of oil and gas learning spillover into geothermal. The learning rate for Advanced EGS cases remains at 35% to reflect the interproject learning observed in commercial EGS drilling projects (El-Sadi et al., 2024). After 2035, the costs in the Moderate and Advanced Scenarios are assumed to decrease annually by 0.5%, just as in the Conservative case.
| Scenario | Base Year–2035 | 2035–2060 |
| Conservative Scenario | 0.5% annual cost reduction | 0.5% annual cost reduction |
| Moderate Scenario | 13% (hydrothermal), 18% (EGS) | 0.5% annual cost reduction |
| Advanced Scenario | 30% (hydrothermal), 35% (EGS) | 0.5% annual cost reduction |
The learning curve equation used to determine future costs (between 2023 and 2035) is the single-factor learning equation as described by (Fukui et al., 2017): $$C(x) = C(x_{0})(x/x_{0})^{-L}$$ where C(x) is the cost at cumulative capacity x, C(x0) is the cost at the first deployment capacity x0, and L is the learning parameter. The learning rate (LR) and L are defined by the following relationship: \(LR=1-2^{-L}\). To convert from capacity to time, the relative capacity, x/x0 at the full deployment year (2035), is first determined using the known 2035 cost and the LR for the specific scenario. Then a simple linear interpolation is applied between 2023 (when x/x0 = 1) and 2035 to determine the x/x0 at intermediate time steps. These values are then applied in the learning curve equation to calculate C(x) for the corresponding years.
| Scenario | ROP (ft/hr) | Bit Life (hr) | EGS Flow Rate (kg/s) |
|---|---|---|---|
| Conservative Scenario (2023)* | 75 | 50 | 60 |
| Moderate Scenario | 50 | 100 | 60 flash/90 binary |
| Advanced Scenario | 100 | 200 | 80 flash/120 binary |
* Drilling parameters are based on an updated baseline drilling cost analysis (Akindipe and Witter, 2025).
Representative Technology
Hydrothermal
Hydrothermal geothermal technologies encompass technologies for exploring for the resource, drilling to access the resource, and building power plants to convert geothermal energy to electricity. Technology costs depend heavily on the hydrothermal resource temperature and well productivity and depth to the point that project costs are site-specific and a "typical" cost applied to any given site would be inaccurate. The 2025 ATB uses scenarios developed by the DOE Office of Geothermal (Mines, 2013) for representative binary and flash hydrothermal power plant technologies.
The first scenario assumes a 175°C resource at a depth of 1.5 km with wells producing an average of 110 kg/s of geothermal brine supplied to a 30-MWe binary (organic Rankine cycle) power plant. The second scenario assumes a 225°C resource at a depth of 2.5 km with wells producing 80 kg/s of geothermal brine supplied to a 40-MWe dual-flash plant. These are midgrade or "typical" temperatures and depths for binary and flash hydrothermal projects.
The 2025 ATB representative technologies fall in the middle to low end of the hydrothermal resources cost estimates typically deployed in Regional Energy Deployment System (ReEDS) model runs.
Enhanced Geothermal Systems
As with costs for projects that use hydrothermal resources, EGS resources are similarly site-specific, and project costs depend heavily on the resource temperature, well productivity, and depth. The 2025 ATB uses scenarios developed by the DOE Office of Geothermal (Mines, 2013) for representative binary and flash Deep-EGS power plants, assuming current EGS technology performance metrics (Norbeck and Latimer, 2023). NF-EGS representative scenarios mimic the temperature, depth, and plant size of the hydrothermal representative plants, but they include EGS techno-economic assumptions such as flow rate, success rate, and well productivity/injectivity. In the context of the GETEM model, NF-EGS systems are assumed to be brownfield projects with lower exploration cost requirements than greenfield Deep-EGS developments.
The first NF-EGS scenario assumes a 175°C resource at a depth of 1.5 km with wells producing an average of 60 kg/s of geothermal brine supplied to a 30-MWe binary (organic Rankine cycle) power plant. The second NF-EGS scenario assumes a 225°C resource at a depth of 2.5 km with wells producing 60 kg/s of geothermal brine supplied to a 40-MWe dual-flash plant. These NF-EGS representative scenarios fall close to the average resource cost estimates seen in the NF-EGS supply curves.
The first Deep-EGS scenario assumes a 175°C resource at a depth of 3 km with wells producing an average of 60 kg/s of geothermal brine supplied to a 30-MWe binary (organic Rankine cycle) power plant. The second Deep-EGS scenario assumes a 250°C resource at a depth of 3.5 km with wells producing 60 kg/s of geothermal brine supplied to a 40-MWe dual-flash plant. These temperatures and depths are at the low-cost end of the EGS supply curve and would be some of the first developed.
Methodology
This section describes the methodology to develop assumptions for CAPEX, O&M, and capacity factor. For standardized assumptions, see labor cost, regional cost variation, materials cost index, scale of industry, policies and regulations, and inflation.
The site-specific nature of geothermal plant cost, the relative maturity of hydrothermal plant technology, and the very early-stage development of EGS technologies make cost projections difficult. The GeoVision scenarios are based on bottom-up analysis of potential cost and performance improvements. The inputs for these scenarios were developed by the national laboratories as part of the GeoVision effort and were reviewed by industry experts.
The cost and performance estimates are calculated using GETEM, a bottom-up cost analysis tool that accounts for each phase of development of a geothermal plant as follows:
- Cost and performance data for hydrothermal generation plants are estimated for each potential site using GETEM. Model results are based on resource attributes (e.g., estimated reservoir temperature, depth, and potential) of each site.
- Site attribute values are from (USGS, 2008) for identified resource potential and from capacity-weighted averages of site attribute values of nearby identified resources for undiscovered resource potential.
- GETEM is used to estimate CAPEX, O&M, and parasitic plant losses that affect net energy production for the three technology innovation scenarios.
Capital Expenditures (CAPEX)
Definition: Based on GETEM component cost calculations and consistent with methodologies implemented by (EIA, 2024), the geothermal plant envelope for the ATB is defined to include the following:
- Geothermal generation plant:
- Exploration, confirmation drilling, well-field development, reservoir stimulation (EGS), plant equipment, and plant construction
- Power plant equipment, well-field equipment, and components for wells (including dry/noncommercial wells).
- Balance of system:
- Installation and electrical infrastructure, such as transformers, switchgear, and electrical system connecting turbines to one another and to the control center
- Project indirect costs, including costs related to engineering, distributable labor and materials, construction management startup and commissioning, and contractor overhead costs, fees, and profit.
- Financial costs:
- Owners' costs, such as development costs, preliminary feasibility and engineering studies, environmental studies and permitting, legal fees, insurance costs, and property taxes during construction
- As in the 2024 ATB, the 10% contingency factor is included in the overall capital cost calculations (Theis, 2021); this contingency factor is not applied to drilling costs because drilling success rates and contingencies are already incorporated into the GETEM model
- Electrical interconnection and on-site electrical equipment (e.g., switchyard), a nominal-distance spur line (<1 mile), and necessary upgrades at a transmission substation; distance-based spur line costs (grid connection costs, or GCC) are now included the ATB
- Interest during construction estimated based on 5-year durations for hydrothermal and EGS for the Advanced Scenario, 7-year durations for hydrothermal and EGS for the Moderate Scenario, and 8-year durations for both hydrothermal and EGS, respectively, for the Conservative Scenario, accumulated at different intervals for hydrothermal and EGS based on schedules as outlined by the GeoVision analysis* (found at www.energy.gov/eere/geothermal/geovision) (ConFinFactor).
* The EGS construction duration is reduced from 10 to 8 years because of accelerated progress in ongoing commercial projects. Therefore, the accumulation for the 9th and 10th years defined in the GeoVision analysis is added to the 8th year accumulation.
In the 2025 ATB, CAPEX is shown for six representative plants. If all sites are used, the CAPEX estimates for all hydrothermal and NF-EGS potential result in a CAPEX range much broader than that shown in the ATB. It is unlikely that the resource potential from all identified sites will be developed because of the high costs for some sites. Effects of regional cost variation and distance-based spur line costs are not estimated.
CAPEX in the ATB does not represent regional cost variants (CapRegMult) associated with labor rates, material costs, or other factors (CapRegMult = 1).
CAPEX in the ATB now includes an ATB-wide technology-agnostic spur line and interconnection (GCC) cost from plant to transmission grid (GCC = $104/kW). See the ATB Definitions page for more details.
Base Year: GETEM inputs are mostly derived from the business-as-usual scenario from the GeoVision report ((DOE, 2019); (Augustine et al., 2019)). Costs are for new or greenfield hydrothermal projects—not for redrilling or additional development/capacity additions at an existing site. The exception is for NF-EGS, where the brownfield hydrothermal assumptions are used in GETEM. The following chart shows historical CAPEX and LCOE for geothermal, including data from the International Renewable Energy Agency (IRENA, 2024).
Future Years: Projections of future geothermal plant CAPEX for three scenarios are derived from modeled costs in the GeoVision report (DOE, 2019) and based on updated learning rates following (Fukui et al., 2017); (Latimer and Meier, 2017); (El-Sadi et al., 2024):
- Conservative Scenario: Continuation of current industry trends in drilling (e.g., minor efficiency improvements with little to no increase in ROP) and EGS (e.g., limited stimulation reproducibility) result in a minimum learning rate and minor CAPEX improvements as implemented in the U.S. Energy Information Administration's Annual Energy Outlook 2015 (EIA, 2015): 10% CAPEX reduction by 2035 (from 2015). This corresponds to a 0.5% annual improvement in CAPEX, which is assumed to continue through 2060.
- Moderate Scenario: Drilling advancements, specifically the Intermediate 1 Drilling Curve (e.g., doubled ROP and bit life and reduced number of casing intervals, associated drilling materials, and timelines) detailed as part of the GeoVision report, result in cost improvements achieved by 2035. The stimulation success rate for EGS is 85% because of advances in zonal isolation during stimulation and improved fractured conductivity post-stimulation (Kneafsey et al., 2022); (Norbeck et al., 2023). Well productivity indexes increase match values in (Snyder et al., 2017) and (Norbeck and Latimer, 2023). Costs decrease according to the learning curves described above from present values to the 2035 projected values followed by a 0.5% annual reduction in CAPEX, because of a minimum learning rate, through 2060.
- Advanced Scenario: Significant drilling and EGS advancements based on modeling in the Technology Improvement scenario of the GeoVision report result in cost improvements achieved by 2035. Costs decrease according to the learning curves described above from present values to the 2035 projected values and are followed by a 0.5% annual reduction in CAPEX, because of a minimum learning rate, through 2060. Drilling improvements, as part of the GeoVision Ideal Drilling Curve, include significantly increased ROP, bit life, and EGS stimulation success, limited casing intervals, and significantly reduced consumption of drilling materials. In addition, the deployment of 100-MW power plants decreases capital costs and fixed O&M costs. Well productivity indexes reflect high-end values found in (Snyder et al., 2017). Progressive EGS demonstrations and commercial projects result in significant advances in EGS exploration drilling success rate and minimal exploration wells required for resource confirmation: 95% and two successful exploration wells, respectively. Finally, permitting timelines are reduced to reflect anticipated permit streamlining effects of a National Geothermal Energy Coordination Office, as enacted through the Energy Act of 2020.
Use the following table to view the components of CAPEX.
Operation and Maintenance (O&M) Costs
Definition: Fixed O&M (FOM) costs represent average annual fixed expenditures (and depend on rated capacity) required to operate and maintain a hydrothermal plant over its lifetime of 30 years (plant and reservoir), including the following:
- Insurance, taxes, land lease payments, and other fixed costs
- Present value and annualized large component overhaul or replacement costs over technical life (e.g., downhole pumps)
- Scheduled and unscheduled maintenance of geothermal plant components and well-field components over the technical lifetime of the plant and reservoir.
Base Year: GETEM is used to estimate FOM for each of the six representative plants. FOM costs for NF-EGS and EGS are equivalent. In the 2022 ATB, Base Year FOM costs were decreased by 23%. This change is carried over to the 2025 ATB and is supported by proprietary geothermal industry FOM data.
Future Years: Future FOM cost reductions are based on results from the GeoVision Technology Improvement scenario (DOE, 2019) and are described in detail by Augustine, Ho, and Blair (Augustine et al., 2019).
Use the following table to view the components of operating expenditures.
Capacity Factor
Definition: Geothermal plant capacity factor is influenced by diurnal and seasonal air temperature variation (for air-cooled plants), technology (e.g., binary or flash), downtime, and internal plant energy losses.
Estimates of capacity factor for geothermal plants in the ATB represent typical operation.
Base Year: The capacity factor estimates are developed using GETEM at typical design air temperature and are based on design plant capacity net losses. An additional reduction is applied to approximate potential variability because of seasonal temperature effects.
Some geothermal plants have experienced year-on-year reductions in energy production, but this is not consistent across all plants. No approximation of long-term degradation of energy output is assumed.
Future Years: Capacity factors remain unchanged from the Base Year through 2060. Technology improvements focus on CAPEX costs. The dispatch characteristics of these systems can be valuable to the electric system to manage changes in net electricity demand. Actual capacity factors will be influenced by the degree to which system operators call on geothermal plants to manage grid services. However, a constant dispatch profile is modeled in the ATB, and no change over time is assumed.
References
The following references are specific to this page; for all references in this ATB, see References.