Financial Cases and Methods
Financial assumptions impact the levelized cost of energy (LCOE) by changing the cost of capital needed to finance electricity generation projects. The equations and variables used to estimate LCOE are defined on the Equations and Variables page.
This section of the Annual Technology Baseline (ATB) focuses on the input variables to the weighted average cost of capital (WACC), which is used in the ATB as the discount rate input to the capital recovery factor for the LCOE formula. The capital recovery factor and the project finance factor determine the fixed charge rate, which incorporates other elements of project finance, including the following:
- Combined federal and state tax rate
- Depreciation schedule of the asset
- Average inflation rate
- Tax incentives.
Incorporating these elements means the LCOE presented in the ATB is pretax. Because the elements mentioned above are fixed or would require changes to legislation, the discussion on this page focuses on the variables in WACC.
Financial Assumptions Cases
Two cases with differing project finance assumptions are used in the Electricity ATB:
- Financing structure without tax incentives based on long-term averages: LCOE improvement is therefore based on research and development (R&D) improvements alone (Without Tax Credits case).
- Financial Assumptions case with tax credits, in which there are market changes (interest rates) and tax credit and depreciation assumptions as of July 2025.
In addition, select technologies in the 2025 ATB are piloting a new Expanded Cost Drivers case, which provides additional sources of change to the underlying metrics such as overnight capital costs:
- R&D Cost Drivers: Estimates costs based on R&D-driven improvements only, as applied to technologies and conditions existing during the most recent year with historical data.
- Expanded Cost Drivers: Estimates costs based on R&D-driven improvements plus other cost drivers, such as changing market and supply chain conditions.
For technologies that present both R&D and Expanded Cost Drivers cases, this leads to four combinations of financial assumptions:
- R&D cost drivers without tax credits: Matches 2024 Electricity ATB's R&D case
- R&D cost drivers with tax credits: Matches 2024 Electricity ATB's Markets and Policies case
- Expanded cost drivers without tax credits
- Expanded cost drivers with tax credits.
Use the following chart to explore the differences between the two financial assumptions cases.
To explore the effect of financial assumptions on LCOE, select a technology and financial assumptions case.
To explore the financial assumptions, select a financial parameter (interest rate, rate of return, capital recovery factor, debt fraction, and WACC), technology, and financial assumptions case.
The definitions for the Without Tax Credits case, the With Tax Credits case, and their respective methodology and assumptions are as follows:
- Without Tax Credits case:
- Estimates technology-specific debt interest rates, return on equity rates, and debt fraction to reflect technological risk perception but with consistent assumptions around sources of capital and ownership across technologies (i.e., independent power producer, financed with a tax equity partnership)
- Holds tax and inflation rates constant at assumed long-term values: 21% federal tax rate, 6% state tax rate (although actual state tax rates vary), and 2.5% inflation rate
- Excludes effects of tax credits.
- With Tax Credits case:
- Retains the technology-specific return on equity rates developed in the Without Tax Credits case
- Modifies the average inflation rate over the life of the project to account for recent inflation (Congressional Budget Office, 2025)
- Applies federal tax credits and depreciation rules and expires them consistent with law and guidelines as of July 10, 2025 (Norton Rose Fulbright, 2025a).
- General methodology and assumptions:
- Renewable generators: Projects with financing terms are owned by independent power producers (IPPs) that have entered into long-term, fixed-price, take-or-pay power purchase agreements (PPAs) for the sale of the electricity. Although PPAs are not the only possible arrangement, they are the dominant form of asset ownership and electricity offtake for new renewable energy assets in the United States.
- Financing structure: Financial structures for IPP-owned projects are assumed to use a tax equity partnership and debt. Tax equity arrangements are a popular financing technique. They generally offer lower-cost equity than sponsor equity for a portion of the project costs in exchange for the associated tax benefits because not all companies can use all the tax benefits.
- Conventional generators: Natural gas plants represent most of all recently installed conventional electricity generation and therefore represent "typical" financial transactions and financing terms. Financing terms reflect natural gas electric generation projects also owned by IPPs that sell power through either a short-term contract or a wholesale spot electricity market, which are otherwise known as quasi-merchant projects. Natural gas plants in unregulated markets have not historically entered into electricity price contracts of the same length as renewable energy generation assets for various reasons, including the challenges of fuel price hedging or contracting for more than a few years.
- Risk assessment: Financial assumptions reflect the different terms offered by financiers to projects with varying levels of risk. Although we recognize in practice these risks may also be reflected in capital expenditures (CAPEX), in soft costs, in a contingency fund, or elsewhere, we believe reflecting risk in the financing terms provides the clearest and most consistent approach. Therefore, we use technology-specific debt interest rates, returns on equity, and debt fractions as a percentage of the total project to reflect technological risk perception. Debt fraction is calculated using a separate financial model, with technology-specific ATB inputs, based on technology-specific assumed debt service coverage ratios (DSCRs).
- Domestic focus: Assumptions primarily reflect technology risk within the U.S. market, but some consideration is given to international development. An individual technology may receive more favorable financing terms outside the United States as a result of macroeconomic factors (e.g., different regulations or different interest rates), more government interventions or more market guarantees, or better market perception of technologies.
- Constant technology risk: Assumptions reflect no change in underlying risk perception for all technologies over time. The modeled renewable technologies have globally deployed billions of dollars in CAPEX and currently receive more favorable financing terms than other electric generation technologies. Although there is still opportunity for further risk perception reduction, because the cost of capital is so favorable, we assume a reduction in risk would likely result in higher leverage―providing equity investors with higher returns (which might have a neutral impact on the overall cost of capital) or electricity offtake agreements that are currently considered riskier than long-term PPAs (i.e., selling electricity into wholesale markets). It should be noted even if the reduction of risk does not lower cost, it could increase adoption by opening more markets and opportunities. At the same time, the differences in risk between technologies reflect underlying technology risks of construction and operation.
- Cost recovery period: Both cases assume a constant cost recovery period―or period over which the initial capital investment is recovered―of 30 years for all technologies. The ATB also provides an option to look at cost recovery over a 20-year period and a "tech life" period in which the lifetime varies by technology.
Methods for Developing Financial Assumptions
This approach to generating the financial assumptions includes technology-specific financial assumptions to 1) capture more granularity of current and future energy markets and 2) show changes in financing rates that are attributable to the reduction or elimination of tax credits for eligible technologies (see below for schedule reductions). Each technology has specific risk factors that might influence the underlying cost of financing. However, a multitude of other factors determines a project's cash flow risk, including the following:
- Political risk
- Regulatory uncertainty
- Project development risk (i.e., risks associated with project cost overruns or the project being behind schedule or not completed at all)
- Government support (if any)
- Ownership risk, including creditworthiness (IPP vs. investor-owned utility vs. public utility)
- Creditworthiness of the electricity offtaker and the length of the contract (if any)
- Whether the electricity price is firm or changes with the market
- Supply and demand of competing electricity and sources of financing (plants with electricity contracts can still be exposed to supply-and-demand risk if financing is at all tied to value after the end of a contract or any risks associated with curtailment)
- Underlying inflation rate and the cost of the base rate (e.g., London Inter-Bank Offered Rate, or LIBOR).
In addition, some projects might receive more favorable financing because of the economies of scale of closing a financial transaction (e.g., it does not take twice the effort to perform financial due diligence on a project that is twice the price). There is also a wider pool of investors with larger projects because some investors have minimum investment thresholds. For these reasons, there is a wide range in financing costs across the United States―and the world―even for the same technology. Long-term PPAs used by renewable energy projects avoid many of the financial risks associated with electricity offtake and price uncertainty. Financing terms for conventional energy generation reflect natural gas electric generation projects owned by IPPs that sell power through short-term contracts or through a wholesale spot electricity market―otherwise known as quasi-merchant projects.
We collect data from various sources that have exposure to different renewable energy technology financing, both in the United States and abroad. In doing so, we try to accurately represent typical financing costs for each technology as well as the differences, if any, between technologies. We collect data points for the following:
- After-tax cost of levered equity during the construction and operation of the asset
- Cost of debt during the construction and operation of the asset
- Amount of debt provided during construction
- Required DSCR debt providers use to determine the amount of debt (i.e., leverage) they would provide a project during the operation of the asset.
In the 2020 ATB through the 2025 ATB―unlike the 2019 ATB and earlier editions―we add the cost of equity during construction. We make this change for two reasons:
- Construction debt providers almost always require a certain percentage of construction costs (typically the first dollars spent) to come from equity providers.
- We hope to differentiate the cost of construction financing from the cost of financing during operations.
In particular, in ATB editions before 2020, the cost of equity for geothermal plants was assumed to be much higher than that of other technologies to account for the risks during construction. By separating these two financing periods, we can lower the cost of equity for a geothermal plant during operation to bring it more in line with real-world financing terms.
Based on recent changes in the cost of capital (BloombergNEF, 2025a); (Norton Rose Fulbright, 2025b) as well as private discussions by National Laboratory of the Rockies (NLR) staff with developers, the 2025 ATB has adjusted the nominal cost of equity for most technologies relative to prior years. Further documentation for differences in the cost of equity can be found in (Feldman et al., 2020) or in prior editions of the ATB.
Based on industry interviews, we include a 2% premium on the cost of equity during construction for each project―with the exception of geothermal, coal, and natural gas projects―relative to the cost of equity during plant operation to account for construction risk. Coal and natural gas do not assume a construction cost premium, but they have a leverage rate of 55%, consistent with the assumptions in (Theis, 2021). In addition, we separate the cost of equity during construction for geothermal into two stages: predrilling (assumed to be 15%) and postdrilling (with assumed site control in place, permitting completed, and a PPA contracted), with no premium on the cost of equity relative to the cost of equity during plant operation.
For interest rates, we collected data of recently issued mid- to long-term debt for renewable energy projects, summarized in the figure below.
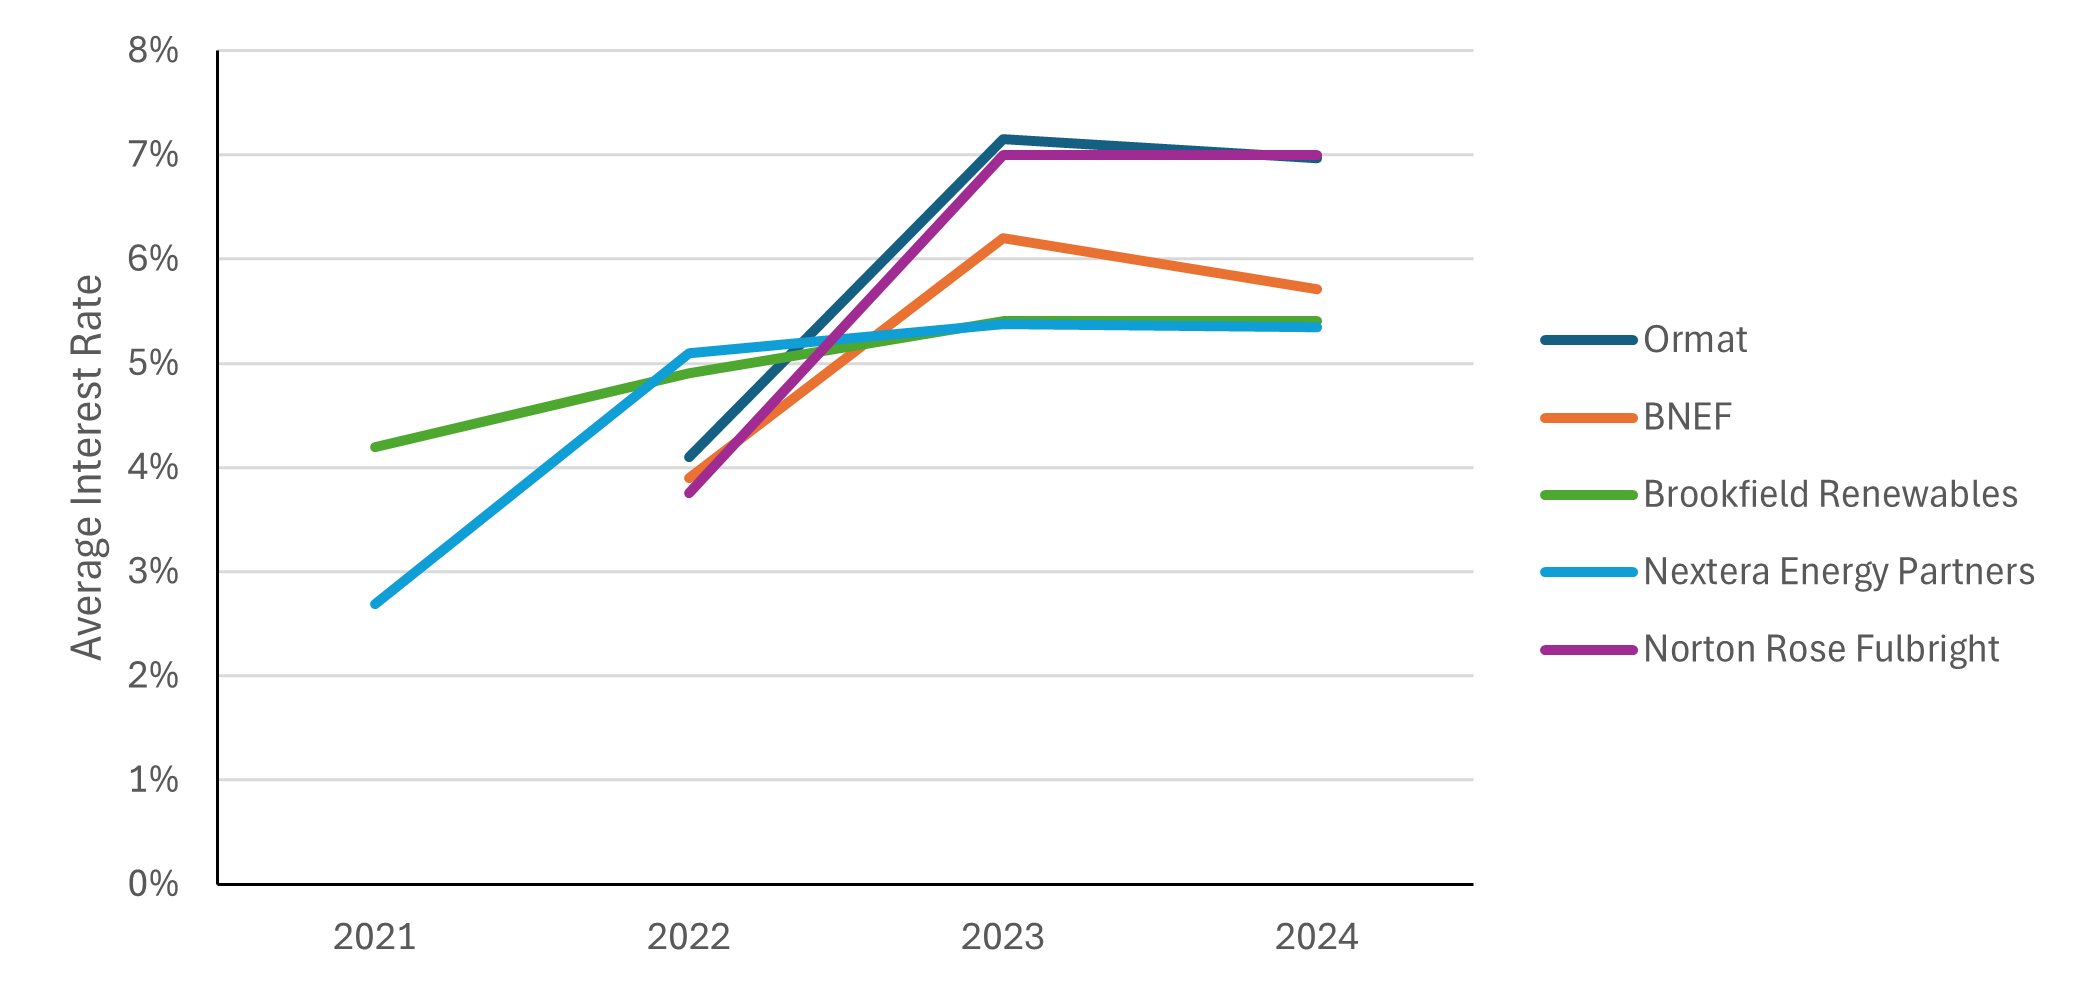
Sources: (BloombergNEF, 2022); (BloombergNEF, 2023); (BloombergNEF, 2025b); (Brookfield Renewable Partners, LP, 2022); (Brookfield Renewable Partners, LP, 2023); (Brookfield Energy Partners, 2025); (Nextera Energy, 2022); (Nextera Energy, 2023); (Nextera Energy, 2024); (Nextera Energy, 2025); (Norton Rose Fulbright, 2024); (Norton Rose Fulbright, 2025b); (Ormat Technologies, 2023); (Ormat Technologies, 2024); (Ormat Technologies, 2025)
As illustrated in the figure, from 2022 to 2023 the typical interest rate of the mid- to long-term debt increased from around 4% to 7%―a 300-basis-point increase, similar to the increase in Treasury Bill rates from Q1 2022 to Q2 2023. The 300-basis-point increase is also consistent with the increase in interest rates assumed between the 2022 ATB and the 2023 ATB. In 2024, data indicate relatively flat interest rate levels, with an approximate 50-basis-point reduction, on average. We have therefore reduced interest rate levels by 50 basis points between the 2024 ATB and the 2025 ATB. We also maintain the 1% relative increase in interest rates for technologies such as natural gas from (Norton Rose Fulbright, 2025b); (BloombergNEF, 2025a). These rates are expected to slightly decline as noted by the most recent Congressional Budget Office's "Long-Term Budget Outlook" (Congressional Budget Office, 2025), which lowered its projection of 10-year Treasury notes over the next decade; for this reason, we implemented a 0.5% decline in interest rates between 2025 and 2035.
According to Norton Rose Fulbright (Norton Rose Fulbright, 2025b), interest during construction is approximately 0.5% lower than term debt, which we implement for all technologies except offshore wind, geothermal, and hydropower—where there is inherently greater construction risk.
Norton Rose Fulbright also reports P50 DSCR (for projects with long-term energy contracts) to be 1.25 for solar photovoltaics (PV), 1.3–1.4 for land-based wind, and 2.0 for battery energy storage systems (BESS) (Norton Rose Fulbright, 2025b). Fitch Ratings reported hydropower plants have the same DSCR as wind projects; Ormat Technologies, which has a large portfolio of geothermal projects, reports a similar DSCR of 1.35 (Ormat Technologies, 2025). P50 represents an average level of energy production (or 50% likelihood to generate that much or more electricity), and P99 represents a production level the project has a 99% chance of exceeding. The assumed P50 DSCR, per technology, is based on collected data of P50 DSCR and is influenced by previously collected data and assumptions from (Feldman et al., 2020). Similar to the cost of equity, technologies with perceived greater operating risk from the financial community tend to have higher DSCRs. We also spoke with financiers regarding the degree to which tax credits are credited as cash flows to cover debt in a DSCR calculation. Interviewees stated that for purposes of sizing a loan, banks generally value the credits at approximately 75% of the value of the cash payments for the credit transfer, though some of this depends on whether there is a forward contract for the credits (which would increase the value a bank would assign the credits). Therefore, when we perform our leverage calculation, we also assume the same reduction in value. A more detailed discussion on transferability and the assumptions and analysis used to derive the reduction in value can be found at Tax Credit Transferability.
The following table summarizes financial assumptions by technology during the project's operation.
| Operation | Construction | ||||||
|---|---|---|---|---|---|---|---|
| Technology | Electricity Sales | After-Tax Equity Returns | Interest Rate of Term Debt | DSCR | After-Tax Equity Returns | Interest Rate of Construction Debt | Leverage |
| Utility PV and Utility PV + Battery | PPA | 8.0% | 6.5% | 1.275 | 10.0% | 6.0% | 80% |
| Utility-Scale Battery Storage Market Factors | PPA | 8.5% | 6.5% | 2.0 | 10.5% | 6.0% | 80% |
| Residential and Commercial PV | PPA | 9.0% | 6.5% | 1.275 | 11.0% | 6.0% | 80% |
| Residential and Commercial Battery Storage Market Factors | PPA | 9.0% | 6.5% | 2.0 | 11.0% | 6.0% | 80% |
| Concentrating Solar Power (CSP) | PPA | 8.5% | 6.5% | 1.45 | 10.5% | 6.0% | 80% |
| Land-Based Wind | PPA | 8.0% | 6.5% | 1.375 | 10.0% | 6.0% | 80% |
| Offshore Wind | PPA | 8.5% | 6.5% | 1.375 | 10.5% | 6.5 | 80% |
| Distributed Wind | PPA | 8.0% | 6.5% | 1.375 | 10.0% | 6.0% | 80% |
| Geothermal | PPA | 8.5% | 6.5% | 1.35 | Predrilling: 15% Postdrilling: 10% | 6.5% | Predrilling: 0% Postdrilling: 75% |
| Hydropower | PPA | 8.5% | 6.5% | 1.35 | 10.5% | 6.5% | 80% |
| Pumped Storage Hydropower | PPA | 8.5% | 6.5% | 1.35 | 10.5% | 6.5% | 80% |
| Natural Gas | Quasi-merchant | 8.5% | 7.5% | 1.45 | 8.5% | 7.5% | 55% |
| Nuclear | PPA | 8.5% | 7.5% | 1.45 | 10.5% | 6.5% | 80% |
Using the above assumptions, we run the System Advisor Model's (SAM's) leveraged partnership-flip cash flow model to calculate debt fractions. We set the internal rate of return and real discount rate equal to the nominal and real rates of return on equity (respectively) and the flip target year to Year 10 to match the expiration of the production tax credit (PTC). We assume the tax equity investor 1) provides 90% of the preflip equity and 2) receives 90% of the tax benefits and project cash. After the flip year, the tax investor receives 10% of the project cash. The resulting debt fractions are viewable above in the Financial Parameters by Technology and Financial Assumptions Case section. This process assumes residential and commercial scale technologies are third-party owned. Systems purchased by the site owner would be subject to a different, likely higher, discount rate.
Another important factor in determining the financial structure for a renewable energy project is the level of tax credits, if any. Below is a summary of the tax credits assumed in analysis for the 2025 ATB. The tax credits assumed in the ATB assume the prevailing wage rates are met and one bonus credit is received by each technology. Each bonus credit can increase the PTC and investment tax credit (ITC) by 10%, whereas failing to meet the wage requirements reduces the credits by a factor of 5 (Norton Rose Fulbright, 2022).
In the 2025 ATB, tax credit transferability is also incorporated into the financial assumptions, because of its increased usage within the marketplace. (Norton Rose Fulbright, 2025b) reports in 2024 approximately half of the tax credits in renewable energy generation financial transactions were transferred to another taxpayer. The benefit of transferability is that it allows project owners to sell some or all credits to another taxpayer who can more efficiently use them. In addition to benefit those buyers provide, there are costs associated with performing these transactions (particularly for smaller projects, per dollar of credit) as well as risks to the buyers of those credits, such as basis risk (i.e., if the Internal Revenue Service [IRS] finds the tax credit should be smaller than what is claimed). Based on industry interviews, we estimate the sales price on a large volume of credits is $0.92 for every $1 of ITC and $0.94 for every $1 of PTC. Given that we estimate half the credits are being sold, the 2025 ATB reduces the ITC by 4% (i.e., 50% of the market multiplied by $0.92/$1 = 96%) and 3% for the PTC (i.e., 50% x $0.94/$1 = 97%). See the Tax Credit Transferability page for additional details.
Most technologies installed in 2025 or later have the option of choosing the production tax credit or the investment tax credit; we choose the credit that minimizes LCOE for the representative plant, as shown below. We assume projects will be eligible for safe harbor provisions and start construction up to 4 years before credits phase out. Additional analysis of bonus credits and ITC vs. PTC options for a particular technology can be performed with ATB-calc or the System Advisor Model.
| Technology | Credit Type | Full Tax Credit Value | Tax Credit Received by IPP (after transfer) | Duration |
| Land-Based Wind | PTC | $33/megawatt-hour (MWh) | $32.0/MWh | 2023–2029 |
| Offshore Wind | ITC | 40% | 38.4% | 2023–2029 |
| Distributed Wind | PTC | $33/MWh | $32.0/MWh | 2023–2029 |
| Utility-Scale PV | ITC | 40% | 38.4% | 2023–2029 |
| Commercial PV | ITC | 40% | 38.4% | 2023–2029 |
| Residential PV | ITC | 30% | 28.8% | 2023–2025 |
| CSP | ITC | 40% | 38.4% | 2023–2029 |
| Geothermal | ITC | 40% | 38.4% | 2023–2037 |
| Hydropower | ITC | 40% | 38.4% | 2023–2037 |
| Pumped Storage Hydropower | ITC | 40% | 38.4% | 2023–2037 |
| Nuclear | ITC | 40% | 38.4% | 2025–2037 |
| Utility-Scale PV + Battery | PTC - PV | $33/MWh | $32.0/MWh | 2023–2029 (2037 for BESS component) |
| ITC - BESS | 40% | 38.4% | ||
| Utility-Scale and Commercial Battery Storage | ITC | 40% | 38.4% | 2023–2037 |
| Residential Battery Storage | ITC | 30% | 28.8% | 2023–2025 |
Assumptions include that labor requirements are met but bonus credits are not included (Norton Rose Fulbright, 2022).
Based on these assumptions as well as CAPEX, fixed operations and maintenance, variable operations and maintenance, capacity factor, and fuel costs, we run financial models to calculate a technology's leverage as governed by the minimum DSCR—assuming a debt amortization schedule of 18 years (which is a common debt amortization period for U.S. renewable energy projects, even if the term of debt is shorter) (Norton Rose Fulbright, 2025b); (Martin, 2019). In general, leverage varies significantly over time only because of changes to interest rate, tax rate, and the amount of tax credits received but not because of CAPEX, fixed operations and maintenance, or capacity factor. For this reason, the same leverage can be used by a technology for various resource classes. The exception to this is projects receiving the PTC (i.e., land-based wind); because PTC value represents a different percentage of project costs for different resource classes, leverage changes. A similar, but smaller, change can also be seen for natural gas, depending on fuel price. Because we cannot input different leverage values for different resource classes in the ATB (because of current programming constraints), we use the leverage for Land-Based Wind Speed Class 4-Technology 1 because it is the most common resource level for land-based wind systems. It is important to consider these relationships occur because the financial model (SAM) solves for return on equity, which will determine the electricity rate needed to achieve specific economic returns. If the financial models were to solve for economic returns, given an assumed electricity rate, the leverage on projects with higher capacity factors (all else being equal) would be greater than those with lower capacity factors. See the parameter value summary above for the calculated leverages for the ATB.
In the Without Tax Credits case, leverage between renewable energy technologies varies only from 69% to 74%. A certain degree of variability in leverage exists between technologies because of differences in capacity factors, return on equity, DSCR, and interest rates. In the With Tax Credits case, the leverage on technologies with tax credits decreases as costs decline and then increases again when the tax credits phase out. Using these values, we calculate WACC for the various technologies, which is summarized in the parameter value summary above.
In the Without Tax Credits case, the nominal after-tax WACC varies from 5.6% to 6.5% for renewable energy technologies, and it is 6.9% for natural gas. A certain degree of variability in WACC exists because of underlying construction and operation risks as well as contract risk for natural gas.
It is important to remember financing costs are one piece of the overall cost competitiveness of a project. Although projects receiving tax credits might have lower leverage and thus a higher WACC, they benefit from the tax credits, which overall reduces the LCOE. Likewise, Wind Speed Class 1 would have a higher WACC than Wind Speed Class 10, but that is because the cost of energy of Wind Speed Class 10 is much higher—which can support a higher modeled debt fraction. Natural gas has the highest calculated leverage, but it still has the highest WACC because of the increased cost of debt and equity (in part because it is the only technology analyzed in the ATB that does not have fully contracted cash flows).
Looking forward, we do not assume a change to the cost of equity or DSCR because many factors might influence these variables. For example, political, corporate, or regulatory changes might push the cost of equity and DSCR higher or lower (e.g., impact the ability to obtain long-term contracted cash flows). The renewable energy industry is working to remove the risk and uncertainty associated with these technologies and provide more consistent expectations of electricity production (e.g., lower failure rates, better energy production forecasting, and more consistent resource availability through taller wind towers). However, renewable energy assets already receive favorable financing because of their ability to receive long-term fixed electricity contracts, the relative demand for low-carbon investments, and the lower-risk benefits of tax credits. Which of these factors will change in the future is unclear. Utilities might stop offering long-term contracts, or project owners might be exposed to more curtailment risk. However, with many states pushing for more carbon-free electricity, utilities might see these long-term contracts as low-cost options to satisfy these requirements; without long-term contracts, utilities might incur higher costs because of the increase in financing costs caused by shorter contracts.
In addition, although curtailment and value loss could be more of an issue in the future as renewable energy assets comprise a larger share of the total electricity generation mix, many active mitigation strategies are being developed―both by individual actors (e.g., pairing storage with renewable energy electric generation) and through larger, grid-level activities. And, although lower average DSCR—through lower risk perception—might support higher project leverage, this benefit might be counteracted by higher equity returns achieved through higher leverage. Historically, many international renewable energy projects have had slightly higher leverage and higher equity returns.
References
The following references are specific to this page; for all references in this ATB, see References.